Table of Contents
Measurements app
Table of Contents
Measurements allows you to get an overview of specific metrics on your hosts over time.
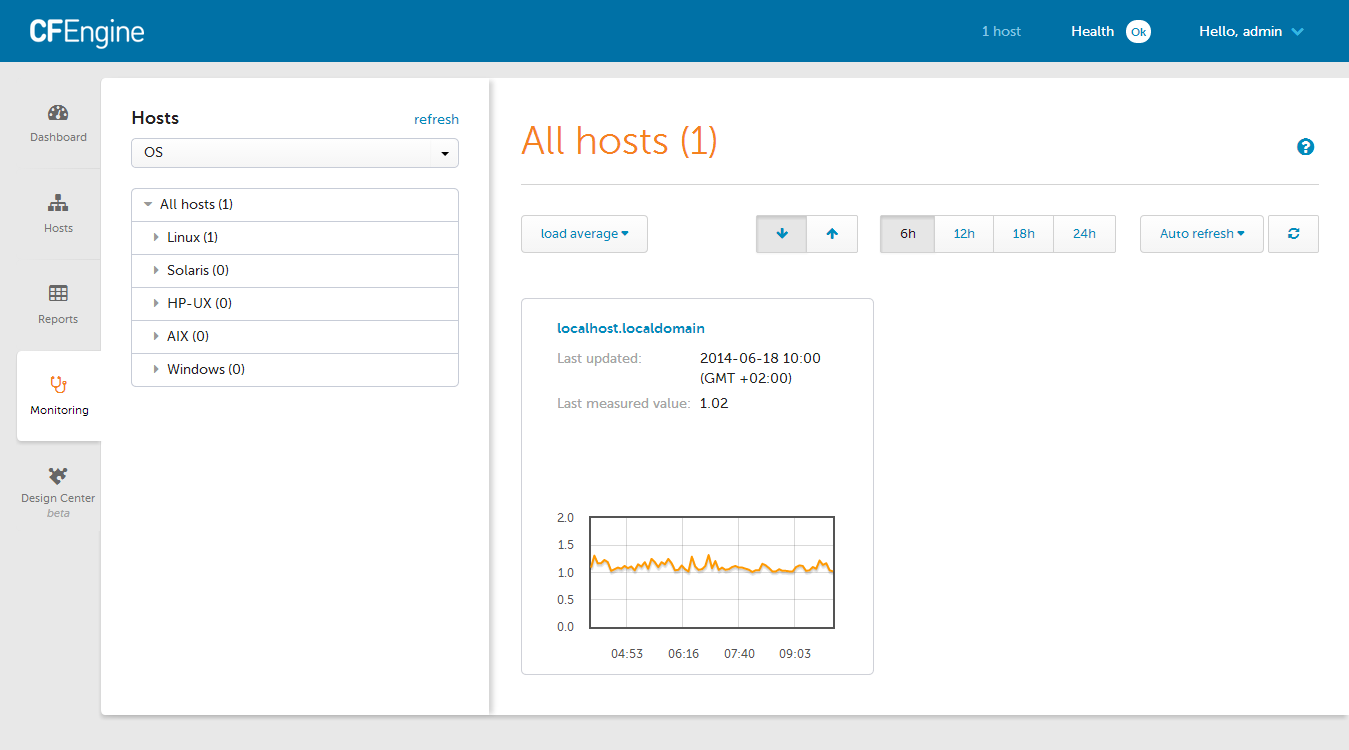
If multiple hosts are selected in the menu on the left, then you can select one of three key measurements that is then displayed for all hosts:
- load average
- Disk free (in %)
- CPU(ALL) (in %)
You can reduce the number of graphs by selecting a sub-set of hosts from the menu on the left. If only a
single host is selected, then a number of graphs for various measurements will be displayed for this host. Which exact measurements are reported depends on how cf-monitord is configured and extended via measurements promises.
Clicking on an individual graph allows to select different time spans for which monitoring data will be displayed.
If you don't see any data, make sure that:
cf-monitordis running on your hosts.cf-hubhas access to collecting the monitoring data from your hosts. See Configuring Enterprise Measurement and Monitoring Collection in the Masterfiles Policy Framework.