Table of Contents
1 Standard reports in CFEngine 3 Enterprise
A significant capability of CFEngine 3 Enterprise is automated system reporting: it collects history, state and change data about computers and ties them together. A report is a tabular summary of CFEngine's internal information, tailored to a particular purpose, searchable, and describes attributes and qualities of managed hosts.
Standard reports in CFEngine 3 Enterprise can be accessed through the Reports tab in the Engineering room. The drop down menus list all standard report categories and each category contains information about different aspects of the Mission. When you click one of them, the Mission Portal will present a query form that is adapted to the chosen report category. CFEngine uses regular expressions in these queries, for maximum flexibility and to minimize system impact. The details of these queries and the content of the resulting reports are outlined in the following sections.
Reports are updated at different intervals, the default values are every 5 minutes or every 6 hours. Below is a list of standard reports, updated every 5 minutes unless otherwise noted:
- Policy
- Compliance by bundle: Status of promise bundles and when they were last verified
- Compliance by promise: Compliance of each promise individually
- Promises not kept log: Log of promises that could not or would not be kept
- Promises not kept summary: Cumulative (histogram) summary of promises not kept
- Promises repaired log: Log of actual repairs made to the system
- Promises repaired summary: Cumulative (histogram) summary of promises repaired
- Accounting
- Benchmarks: Execution time used to verify selected promises
- Business value report: Accumulated value of promises kept (6 hrs)
- Compliance summary: Total summary of host compliance
- System
- Context classes: User defined classes observed on the system
- Last saw neighbours: Log of when neighboring hosts were last observed online
- Variables: Table of variable values last observed (6 hrs)
- Weakest hosts: Ranking of hosts with poorest performing hosts on top
- Software
- Installed: List of software packages claimed to be installed according to the local package manager
- Patches available: A list of patches currently claimed to be available by the local package manager
- Patch installed: A list of (un)applied patches according to the local package manager
- File watch
- Change summary: Log of all detected changes to files from changes promises
- Setuid: Current list of observed setuid/setgid root programs (6 hrs)
- Text changes: Delta/difference comparison showing file changes
Next: Accounting, Previous: Standard reports in CFEngine 3 Enterprise, Up: Standard reports in CFEngine 3 Enterprise
1.1 Policy
1.1.1 Compliance by bundle
Promises are the fundamental statements in CFEngine, they make up the definition of the desired state of a system. A bundle is a collection of promises in a `sub-routine-like' container. The purpose of bundles is to allow greater flexibility to break down the contents of policies and give them names. Bundles also allow to re-use promise code by parameterizing it.
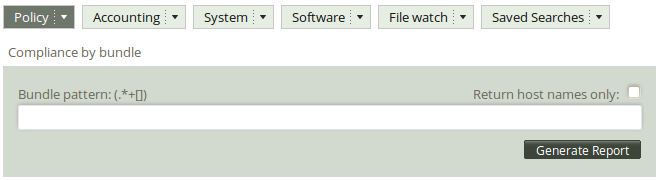
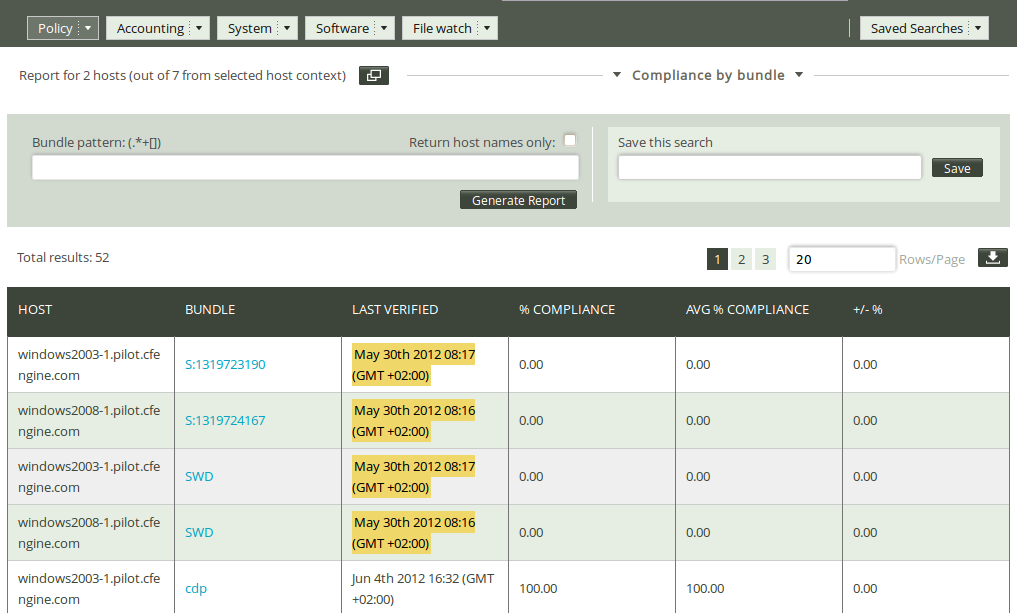
The ‘Compliance by bundle’ is useful for checking the compliance of specific bundles and when they were last verified. Put your mouse over the Policy drop down menu in the Reports tab, then select Compliance by bundle. The Compliance by bundle query can filter by bundle pattern (pattern in bundle name). Leaving the fields blank will result in a report listing all bundles in your policies.
Once you have clicked Generate report, CFEngine 3 Enterprise will list an overview of bundles that suit the query criteria entered above. It displays the host names on which these bundles can be found (‘Host’), the name of the bundles (‘Bundle’), the time stamp at the moment of verification (‘Last verified’), the time passed since last verification (‘Last verified’), the current bundle compliance (‘% compliance’), the average bundle compliance (‘Avg % compliance’) and the deviation of the current compliance from the average (‘+/- %’).
1.1.2 Compliance by promise
Promises are the fundamental statements in CFEngine, the policy atoms. Promises can be made about all kinds of different subjects, from file attributes, to the execution of commands, access control decisions and knowledge relationships. If there is no promise, nothing happens. It is considered compliant if CFEngine is able to keep the promise, and conversely, not compliant, or not kept, in the opposite case.
The ‘Compliance by promise’ report is useful for checking the current status of your system in high detail. You can find out which parts of a bundle work and which do not. The report also predicts the probability of compliance based on the history of specific promises, allowing you to assess the degree to which the problem is of a more transient or permanent nature.
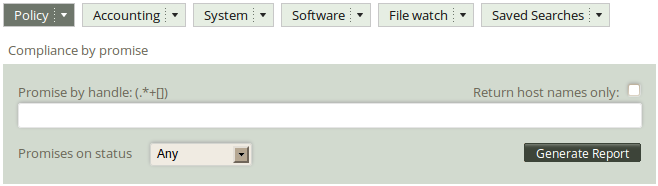
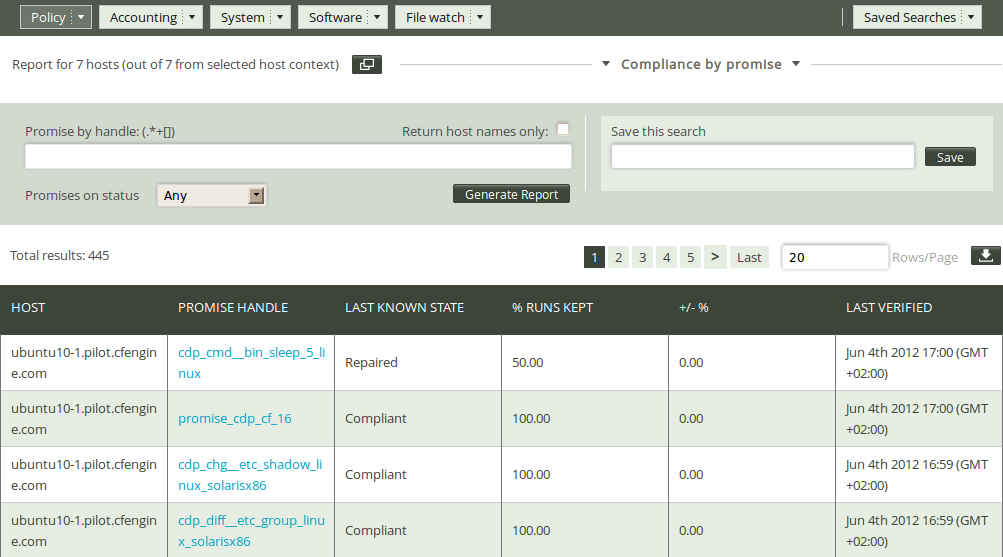
Put your mouse over the Policy drop down menu in the Reports tab, then select Compliance by promise. The compliance by promise query can filter by (patterns in) promise handle and the compliance status of promises (any/compliant/repaired/non-compliant, drop-down menu).
Once you have clicked Generate report, CFEngine 3 Enterprise will list an overview of hosts that suit the query criteria entered above. The result presents the host names (‘Host’), the promise identifier ‘Promise handle’, ‘Last known state’ (compliant or not compliant), likelihood of a promise being compliant (‘% runs kept’), uncertainty of the likelihood (‘+/- %’, measured in one standard deviation of ‘% runs kept’), and the time stamp of the last time the promise was run (‘Last verified’).
1.1.3 Promises not kept log
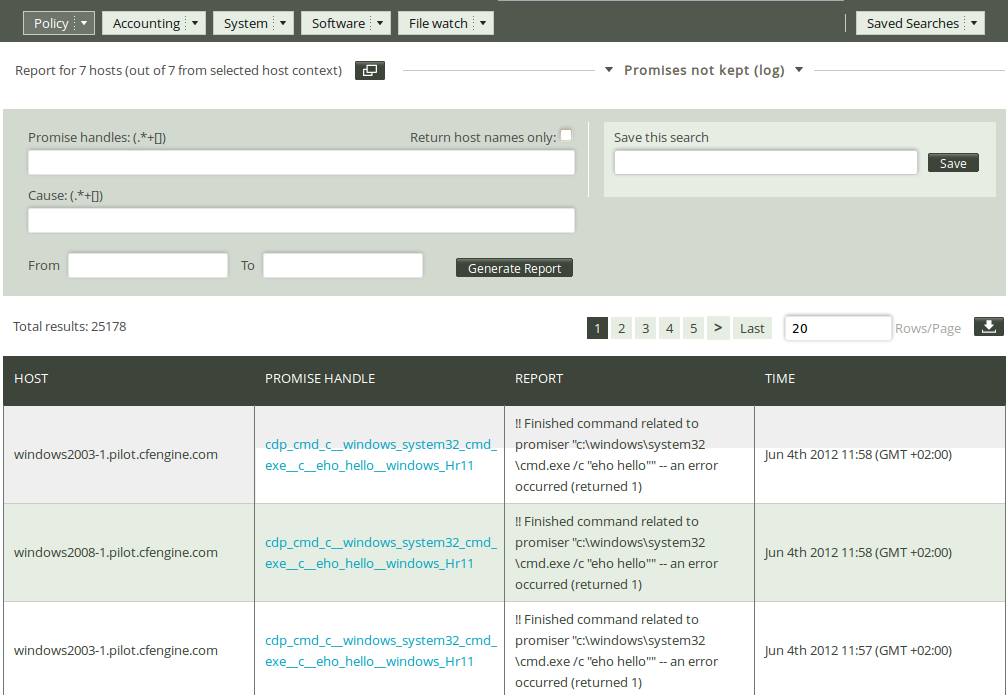
The Business room in the Mission Portal gives an overview of the general status of your system, including six hour summaries of promises kept, repaired, and not kept from the last week. The Promises not kept log is useful to get a complete overview of the history of promises not kept, including execution order and events that are more than a week old. Put your mouse over the Policy drop down menu in the Reports tab, then select Promises not kept log.

The Promises not kept log query can filter by (patterns in) promise handles, cause (i.e. what was not kept), and a desired time interval. Leaving the fields blank will result in a report listing all promises that were not kept and the time of occurrence.
Once you have clicked Generate report, CFEngine 3 Enterprise will list an overview of promises that suit the query criteria entered above. The results are presented as ‘Host’ (host name), ‘Promise handle’ (identifier of the promise), ‘Report’ (what was not kept), and ‘Time’ (time stamp of the event).
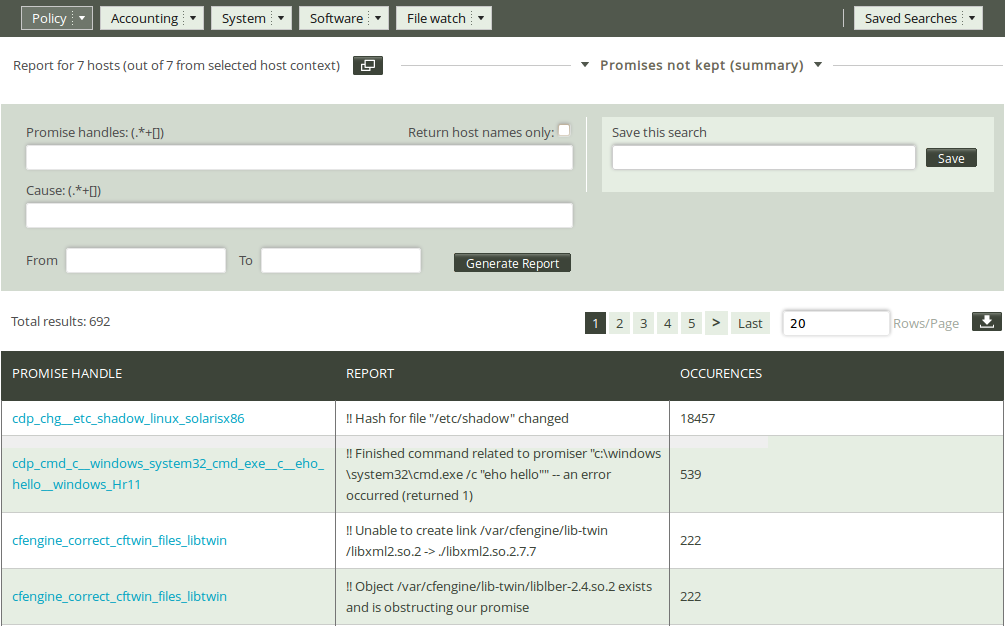
1.1.4 Promises not kept summary
If the Promises not kept log is too detailed for your needs, the Promises not kept summary report eliminates the time stamp of the promises repaired and presents a cumulative summary of promises repaired, i.e. the total number times a promise was not kept. Put your mouse over the Policy drop down menu in the Reports tab, then select Promises not kept summary.
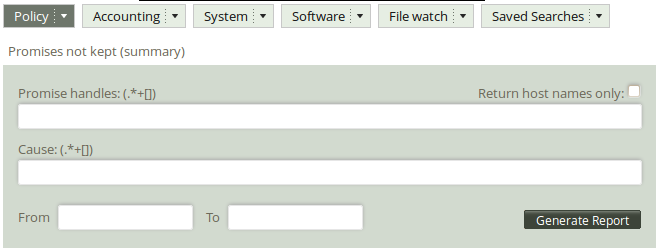
The Promise not kept summary query can filter by (patterns in) promise handles, cause (i.e. what was not kept), and a desired time interval. Leaving the fields blank will result in a report listing all promises that were not kept and their cumulative number of occurrences.
Once you have clicked Generate report, CFEngine 3 Enterprise will list an overview of promises that suit the query criteria entered above. The results are presented as ‘Promise handle’, ‘Report’ (what was not kept), and ‘Occurrences’ (the number of times the promise was not kept).
1.1.5 Promises repaired log
The Business room in the Mission Portal gives an overview of the general status of your system, including six hour summaries of promises kept, repaired, and not kept from the last week. The Promises repaired log is useful to get a complete overview of the history of promises repaired, including execution order and events that are more than a week old. Put your mouse over the Policy drop down menu in the Reports tab, then select Promises repaired log.
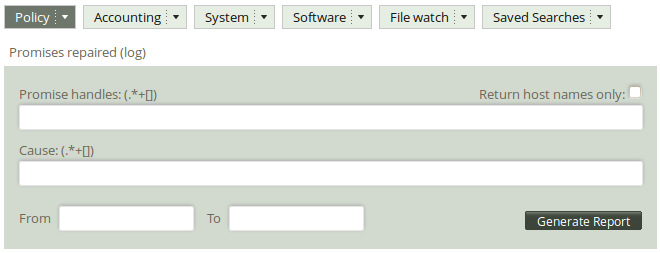
The Promise repaired log query can filter by (patterns in) promise handles, cause (i.e. what was not kept), and a desired time interval. Leaving the fields blank will result in a report listing all promises that were repaired and the time of occurrence.
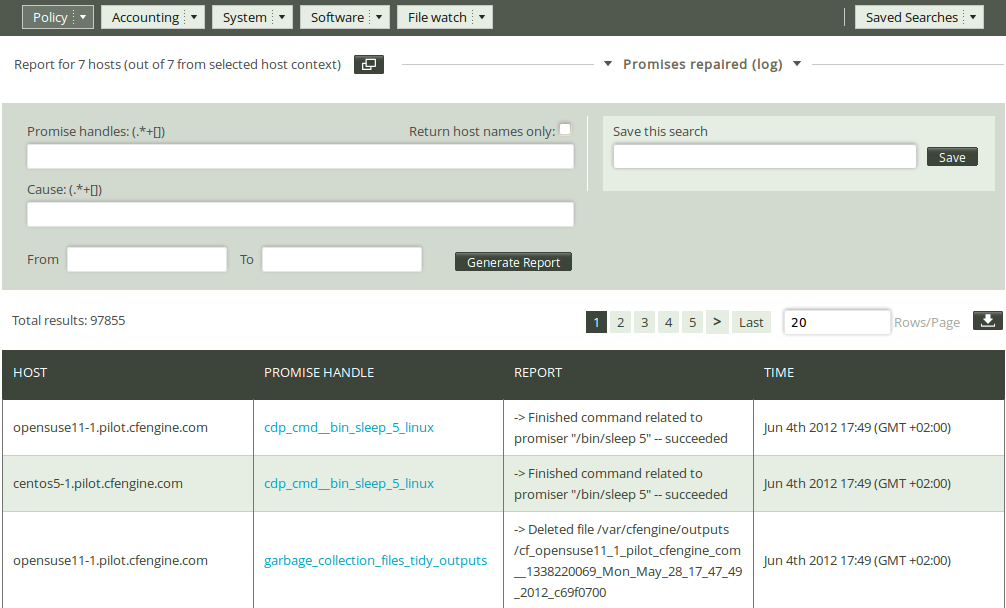
Once you have clicked Generate report, CFEngine 3 Enterprise will list an overview of promises that suit the query criteria entered above. The results are presented as ‘Host’ (host name), ‘Promise handle’ (identifier of the promise), ‘Report’ (what was repaired), and ‘Time’ (time stamp of the repair action).
1.1.6 Promises repaired summary
If the Promises repaired log is too detailed for your needs, the Promises repaired summary report eliminates the time stamp of the promises repaired and presents a cumulative summary of promises repaired, i.e. the total number times a promise has been repaired. Put your mouse over the Policy drop down menu in the Reports tab, then select Promises repaired summary.
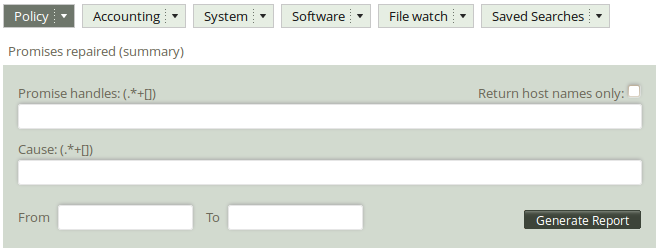
The Promise repaired summary query can filter by (patterns in) promise handles, cause (i.e. what was repaired), and a desired time interval. Leaving the fields blank will result in a report listing all promises that were repaired and their cumulative number of occurrences.
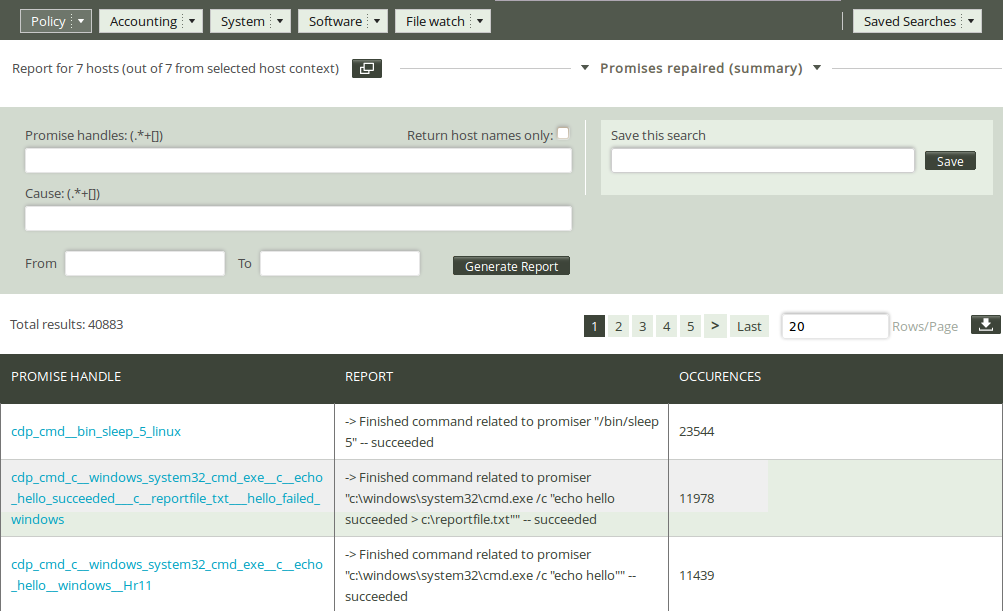
Once you have clicked Generate report, CFEngine 3 Enterprise will list an overview of promises that suit the query criteria entered above. The results are presented as ‘Promise handle’ (identifier of the promise), ‘Report’ (what was repaired), and ‘Occurrences’ (number of occurrences of repair).
1.2 Accounting
1.2.1 Benchmarks
CFEngine 3 Enterprise uses several monitoring probes to reflect on general system performance1. One probe looks at the time it takes to execute selected promises; results are summarized in the ‘Benchmark’ report. The user can thus evaluate which parts of a policy put charge on the system in terms of time spent completing a task. Longer tasks, such as command execution and file copying, are measured by default, but other tasks have to be measured explicitly by stating so in a policy. Note however that most promises made in CFEngine are executed so fast we are not able to measure the time it takes to complete them.
Put your mouse over the Accounting drop down menu in the Reports tab, then select Benchmarks.
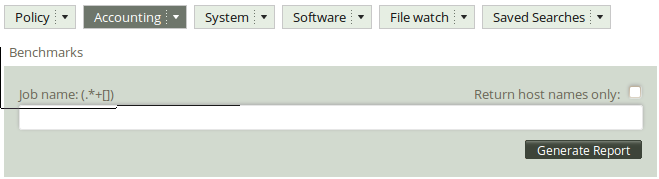
The Benchmark query can filter by (patterns in) job name. Leaving the field blank will result in a report listing the performance of all monitored jobs.
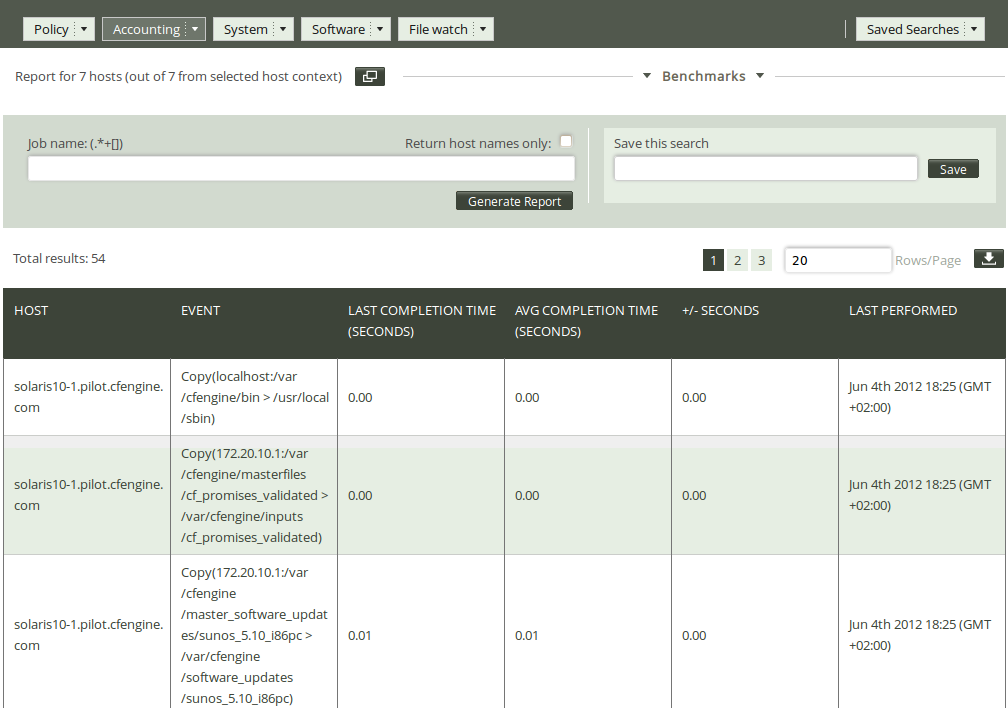
Once you have clicked Generate report, CFEngine 3 Enterprise will list an overview of events that suit the query criteria entered above. ‘Host’ (host name), ‘Event’ (job name), ‘Last completion time’ (most recent performance value, i.e. the time it took to complete the job), ‘Avg completion time’ (average of all Last completion time), ‘+/- seconds’ (difference expressed as one standard deviation of ‘Avg completion time’), and ‘Last performed’ (time stamp of last execution).
1.2.2 Business value
One of the capabilities of CFEngine 3 Enterprise is to add business or organizational value to the configuration model. The notion of business value is not necessarily a clear concept, but a simple approach is to attach a monetary value to the outcome of promises.
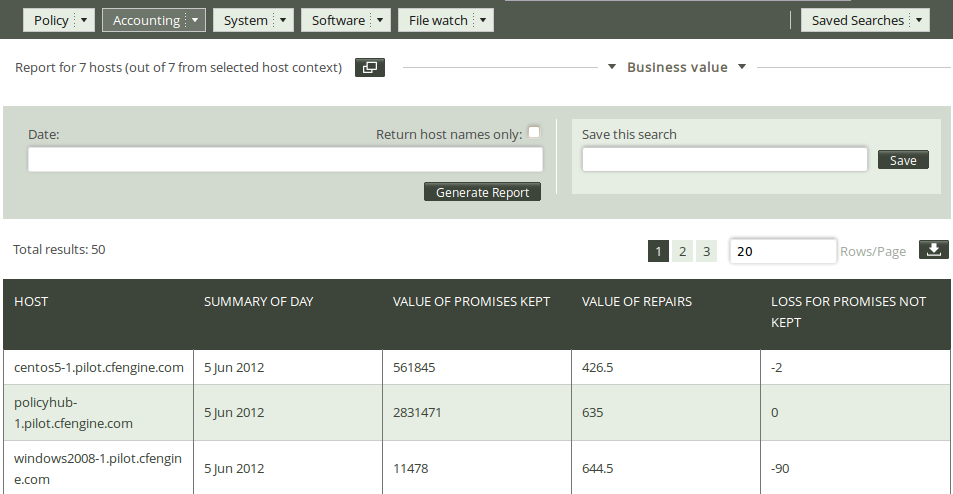
CFEngine's default values for promises kept, promises repaired and promises not kept are 1, 0.5, and -1, respectively. The values are summed and recorded at a set time interval, and the results are summarized for every host and day.
Put your mouse over the Accounting drop down menu in the Reports tab, then select Business value.
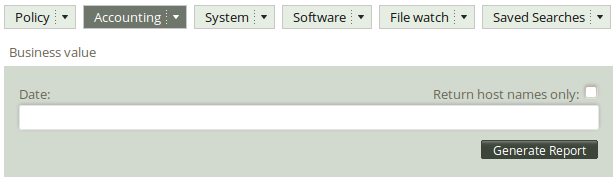
The Business value query can filter by date. Leaving the field blank will result in a report listing the business value of all promises that have had value attached to them over selected hosts and days.
Once you have clicked Generate report, CFEngine 3 Enterprise will list an overview of hosts that suit the query criteria entered above. The result presents each host name (‘Host’), date (‘Summary of Day’), and the sum of the value of the promises kept (‘Value of promises kept’), repaired (‘Value of repairs’), and not kept (‘Loss for promises not kept’).
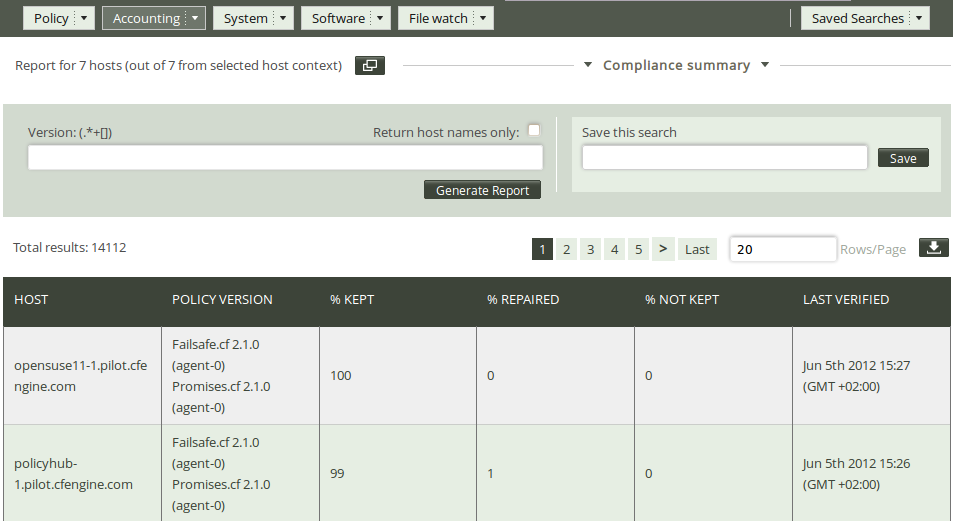
1.2.3 Compliance summary
CFEngine policies are collections of promises contained in a text file, they are the CFEngine scripts that define what state you want your system to be in. The compliance summary report gives an overview of policy status. It shows the current status of your system in a coarse manner, allowing you to quickly identify which areas need follow-up. Put your mouse over the Accounting drop down menu in the Reports tab, then select Compliance summary.

The compliance summary query can filter by version of your policy files (version number is maintained manually in policy). Leaving the field blank will result in a report listing all hosts and and policies.
Once you have clicked Generate report, CFEngine 3 Enterprise will list an overview of hosts that suit the query criteria entered above. The result presents the host names (‘Host’), policy version (‘Policy version’), percentage of promises kept within the listed policies (‘% kept’), percentage of promises repaired within the listed policies (‘% repaired’), percentage of promises not kept within the listed policies (‘% not kept’), and the time stamp of the last status check (‘Last verified’).
1.3 System
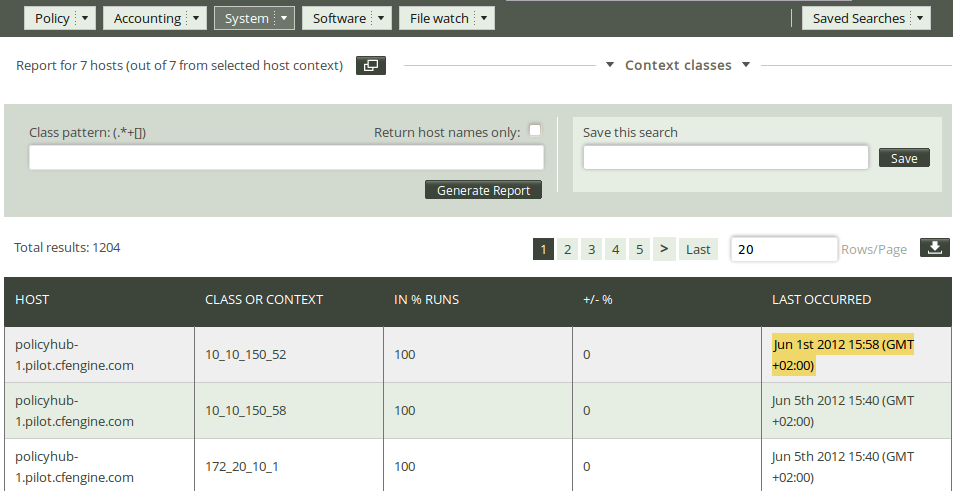
1.3.1 Context classes
CFEngine classes are certain true/false (Boolean) propositions that determine in what context, or setting, a promise is made. Each time CFEngine runs (by default every five minutes), it discovers and classifies properties of the environment in which it runs. These discovered properties are called 'hard classes' and cannot be changed by users. CFEngine also operates with soft classes, i.e. user-defined types.
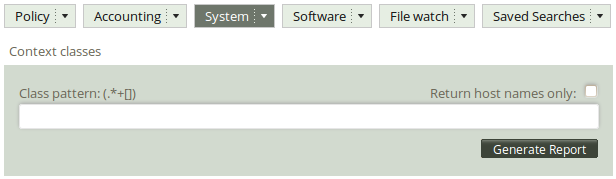
The Context classes report is useful for looking at hosts in specific contexts, for instance to find out which machines run on windows. Put your mouse over the System drop down menu in the Reports tab, then select Context classes.
The context classes query can filter by (pattern in) class name. Leaving the field blank will result in a report listing all hosts and classes.
Once you have clicked Generate report, CFEngine 3 Enterprise will list an overview of hosts that suit the query criteria entered above. The result presents the host names (‘Host’), ‘Class or context’, probability of occurrence (‘In % runs’), uncertainty on the probability ‘+/- %’ (standard deviation of ‘In % runs’), and the last time the class was observed (‘Last occurred’).
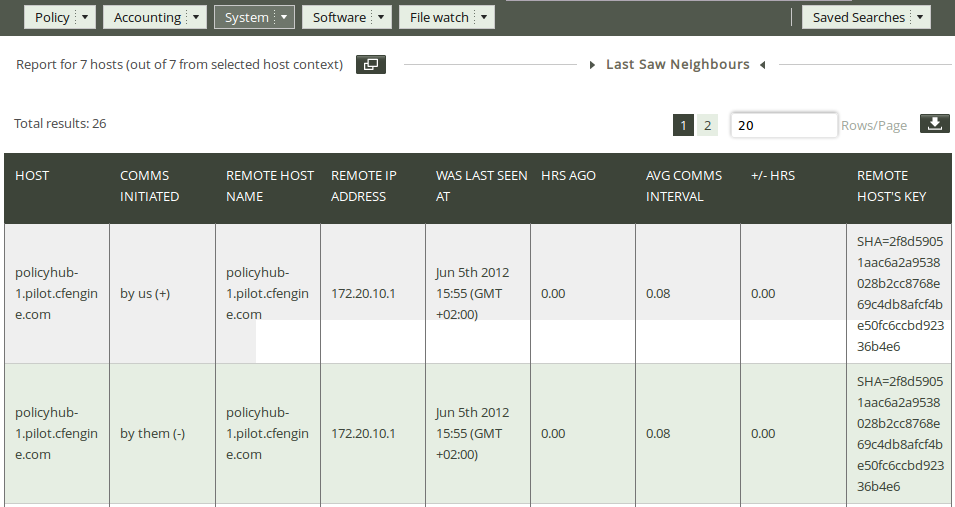
1.3.2 Last saw neighbours
Sometimes it is not possible to connect to a machine under CFEngine's management, either due to network errors or temporary lack of network entirely (for instance on ships at sea or submarines). CFEngine 3 Enterprise's Mission Portal monitors all connections, incoming and outgoing, between all managed hosts, and creates a log of when neighboring hosts were last observed online. This information is used to set the host availability status and, through analysis of the connection history, give an idea of the regularity of connections between hosts.
The Last saw neighbours report is useful for checking the communication pattern between managed hosts and when they last were in touch with each other. Put your mouse over the System drop down menu in the Reports tab, then select Last saw neighbours.
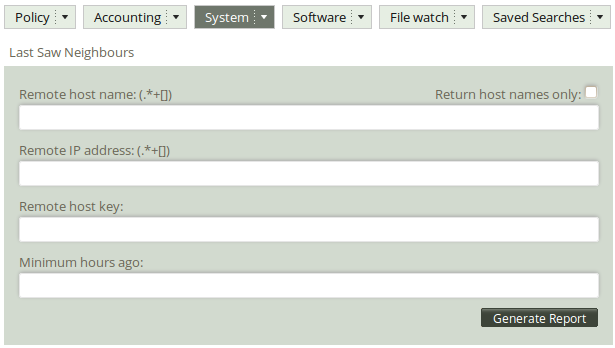
The Last saw neighbours query can filter by (patterns in) remote host name, remote host IP address, remote host key, and minimum hours ago (since the last connection was made). Leaving the fields blank will result in a report listing all connections made to and from the managed machines (including the hub).
Once you have clicked Generate report, CFEngine 3 Enterprise will list an overview of all communication that suits the query criteria entered above. Every connection is logged on the concerned nodes as incoming (Initiated by them) or outgoing (Initiated by us), the same connection will therefore appear twice in the report (once for each node). The results are presented in the following column format: ‘Host’ (host name), ‘Comms initiated’ (identifies whether the connection is incoming (by them (-)) or outgoing (by us (+)), ‘Remote host name’, ‘Remote IP address’, ‘Was last seen at’ (time stamp of the connection), ‘Hrs ago’ (interval between current time and Last seen), ‘Avg comms interval’ (average time between each connection), Uncertainty ‘+/- hrs’ (standard deviation of Average interval), and ‘Remote host's key’ (identifying key of the remote host).
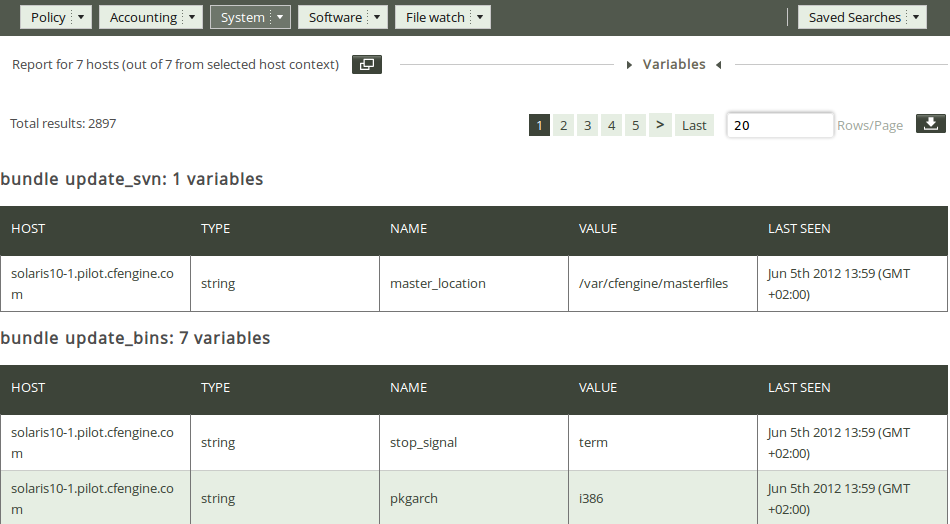
1.3.3 Variables
The ‘Variables report’ is useful for tracking your variables and checking their values, for instance to see if they behave in the expected manner. Put your mouse over the System drop down menu in the Reports tab, then select Variables.
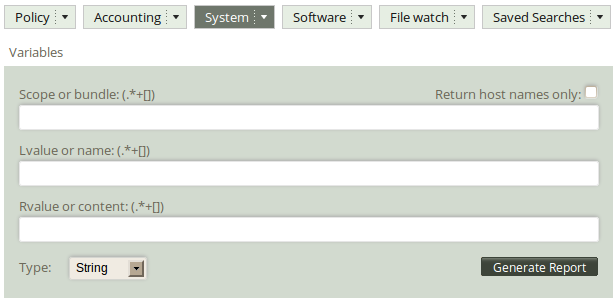
The Variables query can filter by (patterns in) scope (bundle where the variable is used), Lvalue (name of variable), Rvalue (content of variable), and type (string, integer, etc.). Leaving the fields blank will result in a report listing all variables that were last observed on the system.
Once you have clicked Generate report, CFEngine 3 Enterprise will list an overview of variables that suit the query criteria entered above. The results are presented in table form/blocks of scope (i.e. in which bundle the variables appear) with the following column format: ‘Host’ (name of host where the variable is defined), ‘Type’ (type of the variable, ‘Name’, ‘Value’ and ‘Last seen’.
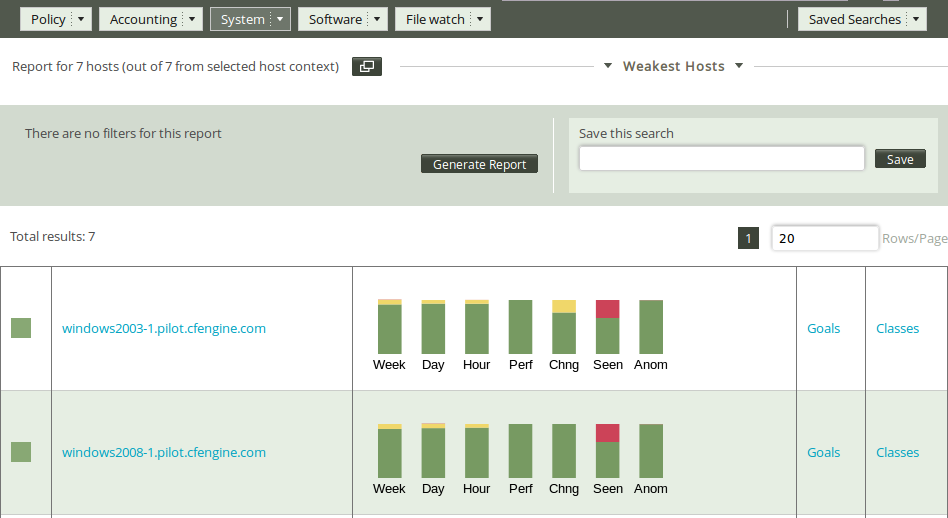
1.3.4 Weakest Hosts
1.4 Software
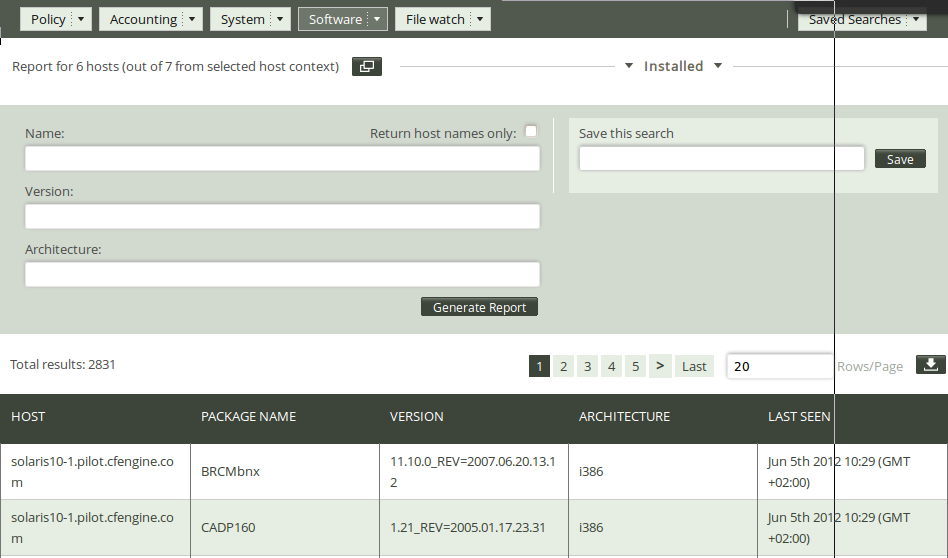
1.4.1 Installed
The ‘Installed report’ will list the software packages claimed to be installed according to the local package manager. Put your mouse over the Software drop down menu in the Reports tab, then select Installed.
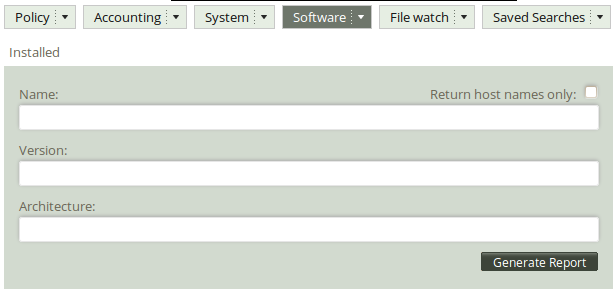
The Software installed query can filter by (patterns in) software name, version, and architecture. Leaving the fields blank will result in a report listing all hosts and software installed on the system.
Once you have clicked Generate report, CFEngine 3 Enterprise will list an overview that suits the query criteria entered above. The results are presented as ‘Host’ (host name), ‘Package name’ (of software package), ‘Version’ (of software package), ‘Architecture’ (of machine on which software runs) and ‘Last seen’.
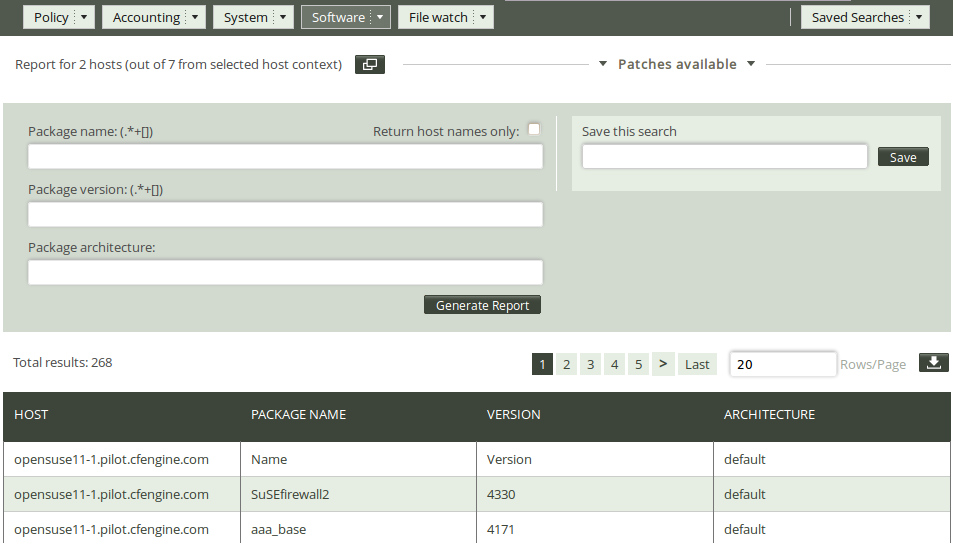
1.4.2 Patches available
Software packaging is a core paradigm in operating system release management today, and CFEngine supports a generic approach to integration with native operating support for packaging. Package promises allow CFEngine to make promises the state of software packages conditionally, given the assumption that a native package manager will perform the actual manipulations. Since no agent can make unconditional promises about another, this is the best that can be achieved.
Some package systems also support the idea of patches. These might be formally different objects to packages; a patch might contain material for several packages and be numbered differently. When you select patching-policy, the package name can be a regular expression that will match possible patch names, otherwise identifying specific patches can be cumbersome.
The patches available report is useful to get an overview of patches claimed to be available by the local package manager. Put your mouse over the Software drop down menu in the Reports tab, then select Patches available.
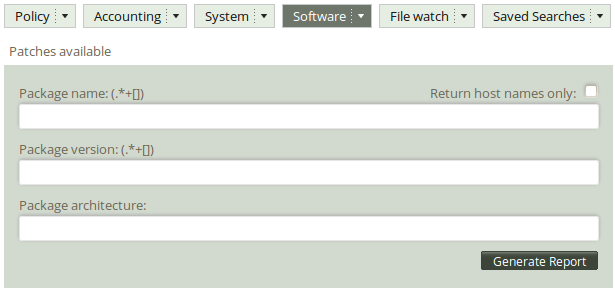
The Patches available query can filter by (patterns in) package name, package version, and package architecture. Leaving the fields blank will result in a report listing all patches that can be installed on the system.
Once you have clicked Generate report, CFEngine 3 Enterprise will list an overview of patches that suit the query criteria entered above. The report presents the following columns: ‘Host’ (host name), ‘Package name’, ‘Version’ (patch version), and ‘Architecture’.
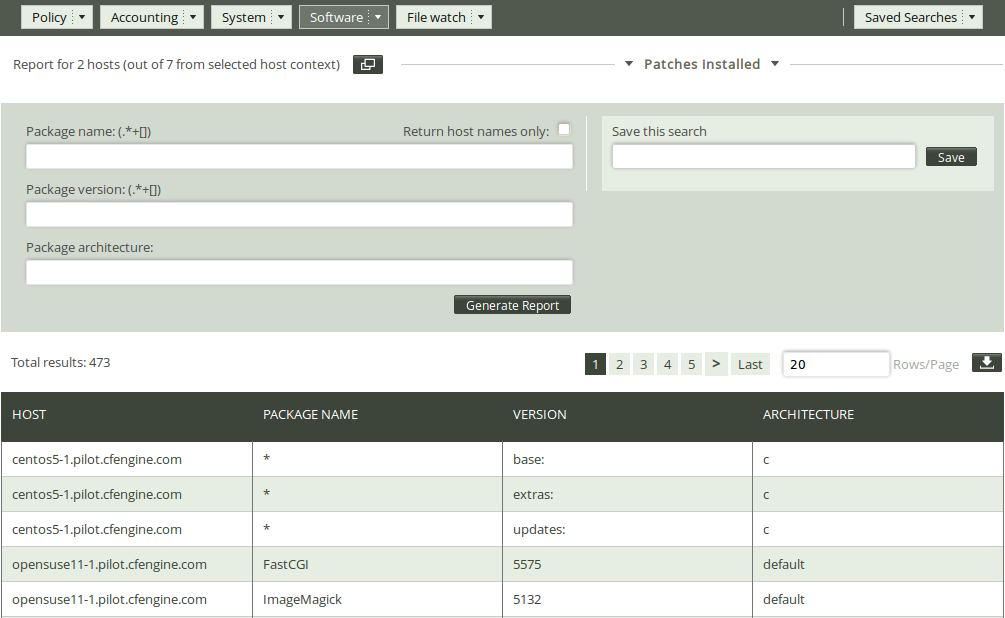
1.4.3 Patches installed
Patch management can be a delicate business: sometimes a patch can cause new problems, or perhaps even more problems than it fixes. IT managers therefore often like to be in control of what patches are applied to a system. The Patch status report gives system administrators a complete overview of applied patches according to the local package manager, and, in conjunction with the patches available report, allows them to consciously decide which patches to apply or not.
Put your mouse over the Software drop down menu in the Reports tab, then select Patches installed.
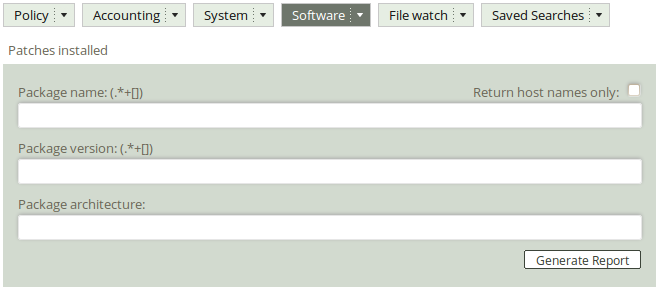
The Patches installed query can filter by (patterns in) package name, package version, and package architecture. Leaving the fields blank will result in a report listing all patches applied to the system.
Once you have clicked Generate report, CFEngine 3 Enterprise will list an overview of patches that suit the query criteria entered above. The report presents results in the same format as the Patches available report: ‘Host’ (host name), ‘Package name’, ‘Version’ (patch version), and ‘Architecture’.
1.5 File watch
1.5.1 Change summary
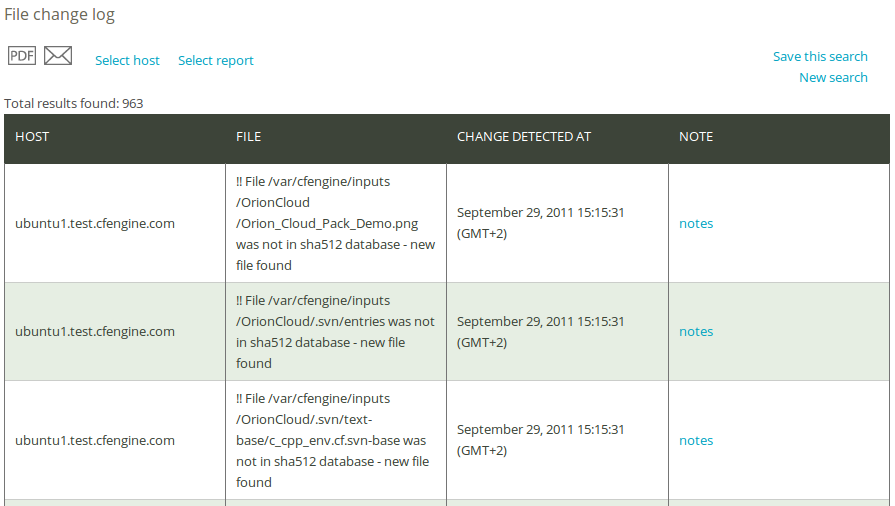
File change monitoring is about detecting when file information on a computer system changes. Awareness of changes is often considered a major part of management, especially if they are unexpected or inadvertent (expected changes are usually not a problem). With CFEngine you can either set a general tripwire to detect all changes, or, in the case of the ‘Change summary’, monitor specific files with changes promises. The report gives you relative detail of change as it presents the name of files that have been changed, when they were changed and on what host they were changed.
Put your mouse over the File watch drop down menu in the Reports tab, then select Change summary.
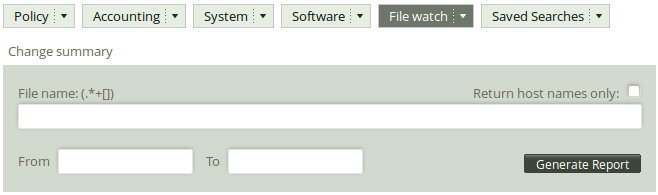
The file change log query can filter by (patterns in) file name and time interval for when the change took place. Leaving the fields blank will result in a report listing changes detected on all monitored hosts and and policies.
Once you have clicked Generate report, CFEngine 3 Enterprise will list an overview of hosts that suit the query criteria entered above. The result presents the host names (‘Host’), name of the file where a change was detected (‘File’), and time stamp of change detection (‘Change detected at’). You can add your personal note in the right column, documenting any thoughts or issues that you might have about the query result.
1.5.2 Setuid
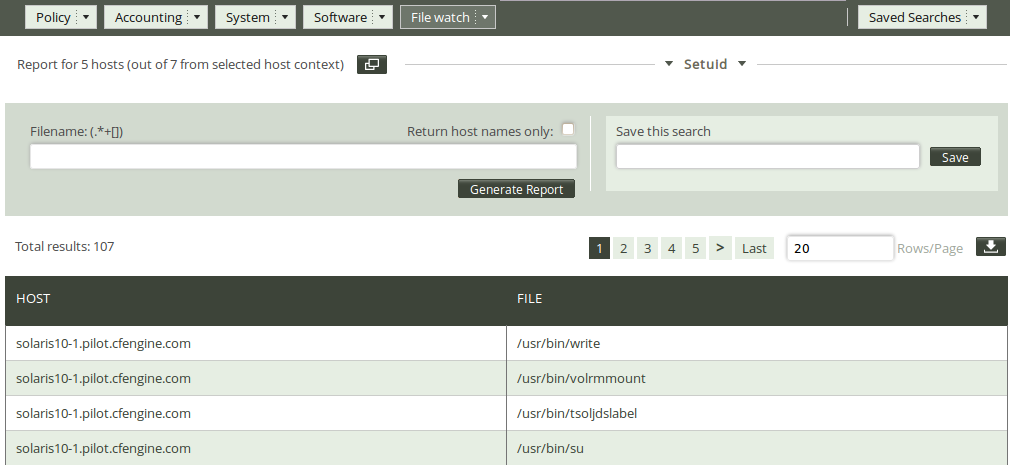
setuid and setgid (short for "set user ID upon execution" and "set group ID upon execution", respectively) are Unix access right flags that allow users to run an executable with the permissions of the executable's owner or group. They are often used to allow users on a computer system to run programs with temporarily elevated privileges in order to perform a specific task. The ‘Setuid report’ is useful to get an overview of what processes have been elevated to root privileges and potentially uncover security issues.
Put your mouse over the File watch drop down menu in the Reports tab, then select Setuid.
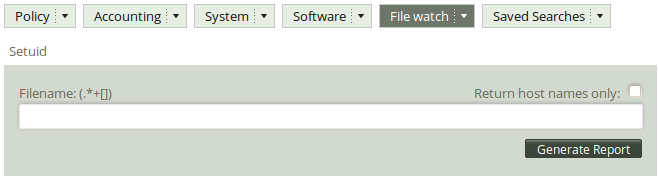
The Setuid/gid root programs query can filter by (patterns in) file name. Leaving the fields blank will result in a report listing all hosts and files that have their permissions elevated to root.
Once you have clicked Generate report, CFEngine 3 Enterprise will list an overview of promises that suit the query criteria entered above. The results are presented as host name and files that have their permissions elevated to root.
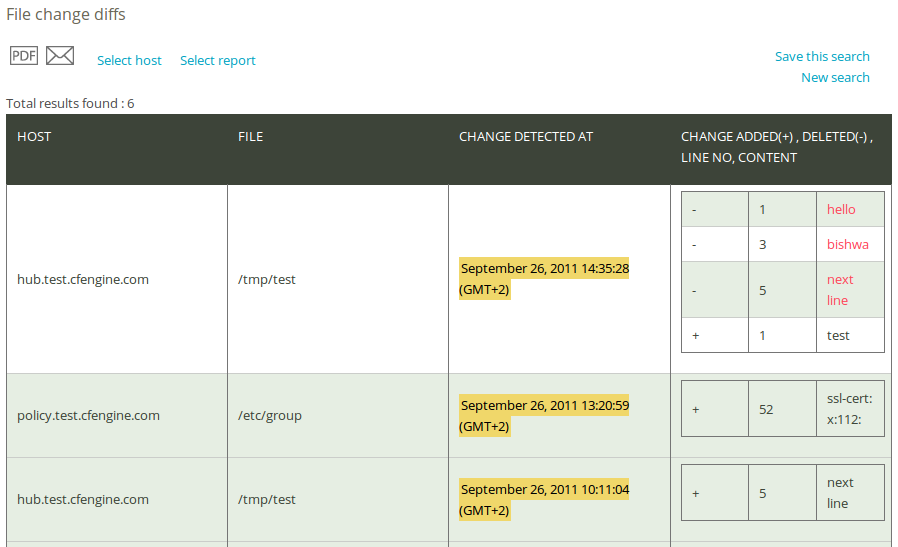
1.5.3 Text changes
A diff is a file comparison utility that outputs the differences between two files. It is typically used to show the changes between one version of a file and a former version of the same file. Diff displays the changes made per line for text files. Once a file change has been identified, for instance as seen in the file change log, you can browse the details of that change in a file change diff report.
Put your mouse over the File watch drop down menu in the Reports tab, then select Text changes.
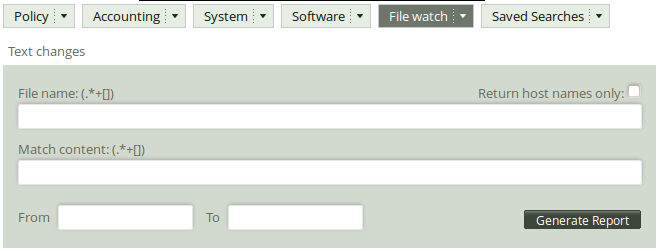
The Text changes query can filter by (pattern in) file name, (pattern in) content, and time interval for when the change took place.. Leaving the fields blank will result in a report listing changes detected on all monitored hosts and and policies.
Once you have clicked Generate report, CFEngine 3 Enterprise will list an overview of hosts that suit the query criteria entered above. The result presents the host names (‘Host’), name of the file where a change was detected (‘File’), the time stamp of change detection (‘Change detected at’), and the actual diff (whether a line was added or deleted, the line number, and the content of the change; ‘Change added (+), deleted (-); Line no; Content ’).