Table of Contents
Most of the settings configurable in the API relate to LDAP authentication of users. Settings support two operations, GET (view settings) and POST (update settings). When settings are updated, they are sanity checked individually and as a whole. All or no settings will be updated for a request.
Request
curl --user admin:admin http://test.cfengine.com/api/settings
Response
{
"meta": {
"page": 1,
"count": 1,
"total": 1,
"timestamp": 1350992335
},
"data": [
{
"ldapPort": 389,
"ldapPortSSL": 636,
"hostIdentifier": "default.sys.fqhost",
"rbacEnabled": true,
"logLevel": "error",
"ldapEnabled": true,
"ldapUsername": "",
"ldapPassword": "",
"ldapEncryption": "ssl",
"ldapLoginAttribute": "uid",
"ldapHost": "ldap.example.com",
"ldapBaseDN": "ou=people,dc=example,dc=com",
"ldapFilter": "(objectClass=inetOrgPerson)",
"blueHostHorizon": 900,
"sketchActivationAlertTimeout": 60
}
]
}
The setting ldapEnabled turns external authentication on or off. When turned
on, the API will check to see that the other LDAP related settings make sense,
and attempt to authenticate using the configured credentials. If it is not
successful in doing this, no settings will be changed. The API will notify you
with a return code an a message describing the error.
Request
curl --user admin:admin http://test.cfengine.com/api/settings -X POST -d
{
"ldapEnabled": true,
"ldapBaseDN": "DC=ldap,DC=example,DC=com",
"ldapEncryption": "ssl",
"ldapHost": "ldap.example.com",
"ldapLoginAttribute": "uid",
"ldapFilter": "(objectClass=inetOrgPerson)",
"ldapPassword": "password",
"ldapUsername": "test",
}
Response
204 No Content
The API uses standard Unix syslog to log a number of events. Additionally, log
events are sent to stderr, which means they may also end up in your Apache
log. Log events are filtered based on the log level in settings. Suppose you
wanted to have greater visibility into the processing done at the backend. The
standard log level is error. Changing it to info is done as follows.
Request
curl --user admin:admin http://test.cfengine.com/api/settings -X POST -d
{
"logLevel": "info"
}
Response
204 No Content
cf-serverd is a socket listening daemon providing two services: it acts as a
file server for remote file copying and it allows an authorized
cf-runagent to start a cf-agent run. cf-agent
typically connects to a cf-serverd instance to request updated policy code,
but may also request additional files for download. cf-serverd employs
role based access control (defined in policy code) to authorize
requests.
cf-serverd keeps the promises made in common and server bundles, and is
affected by common and server control bodies.
--help , -h - Print the help message
--debug , -d - Enable debugging output
--verbose , -v - Output verbose information about the behaviour of the agent
--version , -V - Output the version of the software
--file , -f value - Specify an alternative input file than the default
--define , -D value - Define a list of comma separated classes to be defined at the start of execution
--negate , -N value - Define a list of comma separated classes to be undefined at the start of execution
--no-lock , -K - Ignore locking constraints during execution (ifelapsed/expireafter) if "too soon" to run
--inform , -I - Print basic information about changes made to the system, i.e. promises repaired
--diagnostic , -x - Activate internal diagnostics (developers only)
--no-fork , -F - Run as a foreground processes (do not fork)
--ld-library-path, -L value - Set the internal value of LD_LIBRARY_PATH for child processes
--generate-avahi-conf, -A - Generates avahi configuration file to enable policy server to be discovered in the network
--legacy-output, -l - Use legacy output format
--color , -C value - Enable colorized output. Possible values: 'always', 'auto', 'never'. If option is used, the default value is 'auto'
Settings describing the details of the fixed behavioral promises made by
cf-serverd. Server controls are mainly about determining access policy for
the connection protocol: i.e. access to the server itself. Access to specific
files must be granted in addition.
body server control
{
allowconnects => { "127.0.0.1" , "::1" , ".*\.example\.org" };
allowallconnects => { "127.0.0.1" , "::1" , ".*\.example\.org" };
# Uncomment me under controlled circumstances
#trustkeysfrom => { "127.0.0.1" , "::1" , ".*\.example\.org" };
}
Description: List of IPs or hostnames that may have more than one connection to the server port
This list of regular expressions matches hosts that are allowed to
connect an unlimited number of times up to the maximum connection
limit. Without this, a host may only connect once (which is a very
strong constraint, as the host must wait for the TCP FIN_WAIT to
expire before reconnection can be attempted).
Note that 127.0.0.1 is a regular expression (i.e., "127 any
character 0 any character 0 any character 1"), but this will only
match the IP address 127.0.0.1. Take care with IP addresses and
domain names, as the hostname regular expression www.domain.com
will potentially match more than one hostname (e.g.,
wwwxdomain.com, in addition to the desired hostname
www.domain.com).
Type: slist
Allowed input range: (arbitrary string)
Examples:
allowallconnects => {
"127.0.0.1",
"::1",
"200\.1\.10\..*",
"host\.domain\.tld",
"host[0-9]+\.domain\.com"
};
Description: List of IPs or hostnames that may connect to the server port
If a client's identity matches an entry in this list it is granted to permission to send data to the server port. Clients who are not in this list may not connect or send data to the server.
See also the warning about regular expressions in
allowallconnects.
Type: slist
Allowed input range: (arbitrary string)
Examples:
allowconnects => {
"127.0.0.1",
"::1",
"200\.1\.10\..*",
"host\.domain\.tld",
"host[0-9]+\.domain\.com"
};
Description: List of hosts from which the server accepts connections that are not using the latest protocol.
Set this attribute to an empty list to not allow any incoming connections using legacy protocol versions:
allowlegacyconnects => { }
To define subnets or address ranges, use CIDR notation:
allowlegacyconnects => { "192.168.1.0/24", "192.168.2.123" }
Absence of this attribute means that connections from all hosts are accepted.
Type: slist
Allowed input range: (arbitrary string)
See also: protocol_version
Description: List of ciphers the server accepts.
For a list of possible ciphers, see man page for "openssl ciphers".
Type: string
Allowed input range: (arbitrary string)
Default value: AES256-GCM-SHA384:AES256-SHA
See also: protocol_version
History: Introduced in CFEngine 3.6.0
Description: List of usernames who may execute requests from this server
The usernames listed in this list are those asserted as public key identities during client-server connections. These may or may not correspond to system identities on the server-side system.
Type: slist
Allowed input range: (arbitrary string)
Example:
allowusers => { "cfengine", "root" };
Deprecated: This menu option policy is deprecated, does nothing and is kept for backward compatibility.
Type: boolean
Description: IP of the interface to which the server should bind on multi-homed hosts
On multi-homed hosts, the server and client can bind to a specific interface for server traffic. The IP address of the interface must be given as the argument, not the device name.
Type: string
Allowed input range: (arbitrary string)
bindtointerface => "192.168.1.1";
To bind to all interfaces, including IPV6:
bindtointerface => "::";
Note that a bug in netstat will not correctly report that cf-serverd is listening on both IPV4 and IPV6 interfaces. A test with netcat (nc) will confirm.
# nc -v -4 172.16.100.1 5308
Connection to 172.16.100.1 5308 port [tcp/cfengine] succeeded!
^C
# nc -v -6 fe80:470:1d:a2f::2 5308
Connection to fe80:470:1d:a2f::2 5308 port [tcp/cfengine] succeeded!
^C
Description: Path to the cf-agent command or cf-execd wrapper for remote execution
It is normal for this to point to the location of cf-agent but it
could also point to the cf-execd, or even another program or
shell command at your own risk.
Type: string
Allowed input range: .+
body server control
{
cfruncommand => "/var/cfengine/bin/cf-agent";
}
CFEngine Enterprise only.
Description: The interval in minutes in between collect calls to the CFEngine Server offering a tunnel for report collection.
If option time is set, it causes the server daemon to peer with a policy hub by attempting a connection at regular intervals of the value of the parameter in minutes.
This feature is designed to allow Enterprise report collection from
hosts that are not directly addressable from a hub data-aggregation
process. For example, if some of the clients of a policy hub are
behind NAT or firewall then the hub possibly is not able to
open a connection to port 5308 of the client. The solution is to
enable call_collect_interval on the client's cf-serverd.
Note: also remember to admit the client's IP on the hub's
collect_calls ACL (see resource_type in
bundle server access_rules).
If this option is set, the client's cf-serverd will "peer" with
the server daemon on a policy hub. This means that, cf-serverd on
an unreachable (e.g. NATed) host will attempt to report in to the
cf-serverd on its assigned policy hub and offer it a short time
window in which to download reports over the established
connection. The effect is to establish a temporary secure tunnel
between hosts, initiated from the satellite host end. The
connection is made in such a way that host autonomy is not
compromised. Either hub may refuse or decline to play their role at
any time, in the usual way (avoiding DOS attacks). Normal access
controls must be set for communication in both directions.
Collect calling cannot be as efficient as data collection by the
cf-hub, as the hub is not able to load balance. Hosts that use this
approach should exclude themselves from the cf-hub data
collection.
The sequence of events is this:
cf-serverd connects to its registered CFEngine Servercollect_window seconds to
initiate a query to the host for its reports.Type: int
Allowed input range: 0,99999999999
Example:
call_collect_interval => "5";
The full configuration would look something like this
#########################################################
# Server config
#########################################################
body server control
{
allowconnects => { "10.10.10" , "::1" };
allowallconnects => { "10.10.10" , "::1" };
trustkeysfrom => { "10.10.10" , "::1" };
call_collect_interval => "5";
}
#########################################################
bundle server access_rules()
{
access:
policy_server::
"collect_calls"
resource_type => "query",
admit => { "10.10.10.10" };
satellite_hosts::
"delta"
comment => "Grant access to cfengine hub to collect report deltas",
resource_type => "query",
admit => { "policy_hub" };
"full"
comment => "Grant access to cfengine hub to collect full report dump",
resource_type => "query",
admit => { "policy_hub" };
}
History: Was introduced in Enterprise 3.0.0 (2012)
CFEngine Enterprise only.
Description: A time in seconds that a collect-call tunnel remains open to a hub to attempt a report transfer before it is closed
Type: int
Allowed input range: 0,99999999999
collect_window => "15";
Default value: 10.
History: Was introduced in Enterprise 3.0.0 (2012)
Description: true/false accept connections from hosts with clocks that are out of sync
A possible form of attack on the fileserver is to request files based on time by setting the clocks incorrectly. This option prevents connections from clients whose clocks are drifting too far from the server clock (where "too far" is currently defined as "more than an hour off"). This serves as a warning about clock asynchronization and also a protection against Denial of Service attempts based on clock corruption.
Type: boolean
Default value: true
Example:
body server control
{
denybadclocks => "true";
}
Description: List of IPs or hostnames that may NOT connect to the server port
Hosts or IP addresses that are explicitly denied access. This should only be used in special circumstances. One should never grant generic access to everything and then deny special cases. Since the default server behavior is to grant no access to anything, this list is unnecessary unless you have already granted access to some set of hosts using a generic pattern, to which you intend to make an exception.
See also the warning about regular expressions in
allowallconnects.
Type: slist
Allowed input range: (arbitrary string)
Example:
body server control
{
denyconnects => { "badhost\.domain\.evil", "host3\.domain\.com" };
}
Deprecated: This is now handled transparently.
List of IPs or hostnames for which the IP/name binding is expected to change
The addresses or hostnames here are expected to have non-permanent address-name bindings, we must therefor work harder to determine whether hosts credentials are trusted by looking for existing public keys in files that do not match the current hostname or IP.
Type: slist
Allowed input range: (arbitrary string)
Example:
body server control
{
dynamicaddresses => { "dhcp_.*" };
}
Deprecated: Host identification is now handled transparently.
true/false store keys using hostname lookup instead of IP addresses
Client side choice to base key associations on host names rather than IP address. This is useful for hosts with dynamic addresses.
Type: boolean
Default value: false
Example:
body server control
{
hostnamekeys => "true";
}
Description: Maximum number of hours to hold public keys in the cache
Type: int
Allowed input range: 0,99999999999
Default value: 24
Example:
body server control
{
keycacheTTL => "24";
}
History: Was introduced in version 3.1.0b1,Enterprise 2.0.0b1 (2010)
Description: true/false causes the server to log all new connections to syslog
If set, the server will record connection attempts in syslog.
Type: boolean
Default value: false
Example:
body server control
{
logallconnections => "true";
}
Description: true/false log all successful transfers required to be encrypted
If true the server will log all transfers of files which the server
requires to encrypted in order to grant access (see ifencrypted)
to syslog. These files are deemed to be particularly sensitive.
Type: boolean
Default value: false
Example:
body server control
{
logencryptedtransfers => "true";
}
Description: Maximum number of connections that will be accepted
Watch out for kernel limitations for maximum numbers of open file descriptors which can limit this.
Type: int
Allowed input range: 0,99999999999
Default value: 30 remote queries
Example:
# client side
body agent control
{
maxconnections => "1000";
}
# server side
body server control
{
maxconnections => "1000";
}
Description: Default port for the CFEngine server
Type: int
Allowed input range: 1,65535
Default value: 5308
Example:
body hub control
{
port => "5308";
}
body server control
{
specialhost::
port => "5308";
!specialhost::
port => "5308";
}
Notes:
The standard or registered port number is tcp/5308. CFEngine does not presently use its registered udp port with the same number, but this could change in the future.
Changing the standard port number is not recommended practice. You should not do it without a good reason.
Description: Menu option for syslog facility level
Type: (menu option)
Allowed input range:
LOG_USER
LOG_DAEMON
LOG_LOCAL0
LOG_LOCAL1
LOG_LOCAL2
LOG_LOCAL3
LOG_LOCAL4
LOG_LOCAL5
LOG_LOCAL6
LOG_LOCAL7
See syslog notes.
Default value: LOG_USER
Example:
body server control
{
serverfacility => "LOG_USER";
}
Description: This option is obsolete, does nothing and is retained for backward compatibility.
Type: slist
Allowed input range: (arbitrary string)
Example:
body server control
{
skipverify => { "special_host.*", "192.168\..*" };
}
Description: List of IPs from whom we accept public keys on trust
If connecting hosts' public keys have not already been trusted, this allows us to accept the keys on trust. Normally this should be an empty list except in controlled circumstances.
See also the warning about regular expressions in
allowallconnects.
Type: slist
Allowed input range: (arbitrary string)
Example:
body server control
{
trustkeysfrom => { "10\.0\.1\.1", "192\.168\..*"};
}
Description: true/false enable server daemon to listen on defined port
This attribute allows to disable cf-serverd from listening on any
port. Should be used in conjunction with call_collect_interval.
This setting only applies to CFEngine clients, the policy hub will
not be affected. Changing this setting requires a restart of
cf-serverd for the change to take effect.
Type: boolean
Default value: true
Example:
body server control
{
listening_host_context::
listen => "true";
!listening_host_context::
listen => "false";
}
History: Was introduced in 3.4.0, Enterprise 3.0 (2012)
Prototype: isgreaterthan(value1, value2)
Return type: boolean
Description: Returns whether value1 is greater than value2.
The comparison is made numerically if possible. If the values are strings, the comparison is lexical (based on C's strcmp()).
Arguments:
Example:
body common control
{
bundlesequence => { "example" };
}
bundle agent example
{
classes:
"ok" expression => isgreaterthan("1","0");
reports:
ok::
"Assertion is true";
!ok::
"Assertion is false";
}
Output:
R: Assertion is true
Reports promises simply print messages. Outputting a message without qualification can be a dangerous operation. In a large installation it could unleash an avalanche of messaging.
reports:
"literal string or file refererence",
printfile = printfile_body,
...;
Messages outputted from report promises are prefixed with the letter R to distinguish them from other output, for example from commands.
bundle agent report
{
reports:
"/etc/passwd except $(const.n)"
# printfile => pr("/etc/passwd","5");
showstate => { "otherprocs", "rootprocs" };
}
Common attributes are available to all promise types. Full details for common attributes can be found in the Common Attributes section of the Promise Types and Attributes page. The common attributes are as follows:
Description: Regular expression to keep selected hosts from the friends report list
This regular expression should match hosts we want to exclude from friend reports.
Type: string
Allowed input range: (arbitrary string)
Example:
reports:
"Friend status report"
lastseen => "0",
friend_pattern => "host1|host2|.*\.domain\.tld";
Description: Real number threshold [0,1] of intermittency about current peers, report above
Type: real
Allowed input range: 0,1
Default value: intermittency => "0"
Description: Outputs the content of a file to standard output
Type: body printfile
Description: Path name to the file that is to be sent to standard output
Include part of a file in a report.
Type: string
Allowed input range: "?(/.*)
Description: Integer maximum number of lines to print from selected file
Type: int
Allowed input range: 0,99999999999
Example:
bundle agent example
{
reports:
"$(sys.date) - current message of the day:"
printfile => "motd";
}
body printfile motd
{
file_to_print => "/etc/motd";
number_of_lines => "10";
}
Description: The path and filename to which output should be appended
Append the output of the report to the named file instead of standard output. If the file cannot be opened for writing then the report defaults to the standard output.
Type: string
Allowed input range: "?(/.*)
Example:
bundle agent test
{
reports:
"$(sys.date),This is a report from $(sys.host)"
report_to_file => "/tmp/test_log";
}
Description: The promiser is to be interpreted as a literal value that the caller can accept as a result for this bundle; in other words, a return value with array index defined by this attribute.
Return values are limited to scalars.
Type: string
Allowed input range: [a-zA-Z0-9_$(){}\[\].:]+
Example:
body common control
{
bundlesequence => { "test" };
}
bundle agent test
{
methods:
"any" usebundle => child,
useresult => "my_return_var";
reports:
"My return was: \"$(my_return_var[1])\" and \"$(my_return_var[2])\"";
}
bundle agent child
{
reports:
# Map these indices into the useresult namespace
"this is a return value"
bundle_return_value_index => "1";
"this is another return value"
bundle_return_value_index => "2";
}
Description: Integer time threshold in hours since current peers were last seen, report absence
After this time has passed, CFEngine will begin to warn about the host
being overdue. After the lastseenexpireafter expiry time, hosts will be
purged from this host's database.
Type: int
Allowed input range: 0,99999999999
Default value: lastseen => 168 # one week
Example:
reports:
"Comment"
lastseen => "10";
Deprecated: This attribute is kept for source compatibility, and has no effect. Deprecated in CFEngine 3.5.
See the processes promises documentation for a
comprehensive reference on the body types and attributes used here.
To use these bodies, add the following to your policy:
body file control
{
inputs => { "processes.cf" }
}
Prototype: process_kill(name)
Description: Kill a process by name (can be a regular expression)
Arguments:
name: the regular expression or stringExample:
methods:
"kill" usebundle => process_kill("badprocess");
Implementation:
bundle agent process_kill(name)
{
processes:
!windows::
# Signals are presented as an ordered list to the process.
"$(name)" signals => { "term", "kill" };
windows::
# On Windows, only the kill signal is supported, which terminates the process.
"$(name)" signals => { "kill" };
}
Prototype: exclude_procs(x)
Description: Select all processes excluding those matching x
Arguments:
x: Regular expression matching the command/cmd field
of the processes that should be excludedImplementation:
body process_select exclude_procs(x)
{
command => "$(x)";
process_result => "!command";
}
Prototype: days_older_than(d)
Description: Select all processes that are older than d days
Arguments:
d: Days that processes need to be old to be selectedImplementation:
body process_select days_older_than(d)
{
stime_range => irange(ago(0,0,"$(d)",0,0,0),now);
process_result => "!stime";
}
Prototype: by_owner(u)
Description: Select processes owned by user u
Arguments:
u: The name of the userMatches processes against the given username and the given username's uid in case only uid is visible in process list.
Implementation:
body process_select by_owner(u)
{
process_owner => { "$(u)", canonify(getuid("$(u)")) };
process_result => "process_owner";
}
Prototype: by_pid(pid)
Description: Select a process matching the given PID
Arguments:
pid: PID of the process to be matchedImplementation:
body process_select by_pid(pid)
{
pid => irange("$(pid)","$(pid)");
process_result => "pid";
}
Prototype: any_count(cl)
Description: Define class cl if the process is running
Arguments:
cl: Name of the class to be definedImplementation:
body process_count any_count(cl)
{
match_range => "0,0";
out_of_range_define => { "$(cl)" };
}
Prototype: check_range(name, lower, upper)
Description: Define a class if the number of processes is not within the specified range.
Arguments:
name: The name part of the class $(name)_out_of_rangelower: The lower bound of the rangeupper: The upper bound of the rangeImplementation:
body process_count check_range(name,lower,upper)
{
match_range => irange("$(lower)","$(upper)");
out_of_range_define => { "$(name)_out_of_range" };
}
This is a standalone policy that will kill the sleep process. You can adapt
it to make sure that any undesired process is not running.
body common control
{
bundlesequence => { "process_kill" };
}
bundle agent process_kill
{
processes:
"sleep"
signals => { "term", "kill" }; #Signals are presented as an ordered list to the process.
#On Windows, only the kill signal is supported, which terminates the process.
}
This policy can be found in /var/cfengine/share/doc/examples/unit_process_kill.cf.
Example run:
# /bin/sleep 1000 &
[1] 5370
# cf-agent -f unit_process_kill.cf
[1]+ Terminated /bin/sleep 1000
#
Now let's do it again with inform mode turned on, and CFEngine will show the process table entry that matched the pattern we specified ("sleep"):
# /bin/sleep 1000 &
[1] 5377
# cf-agent -f unit_process_kill.cf -IK
2013-06-08T16:30:06-0700 info: This agent is bootstrapped to '192.168.183.208'
2013-06-08T16:30:06-0700 info: Running full policy integrity checks
2013-06-08T16:30:06-0700 info: /process_kill/processes/'sleep': Signalled 'term' (15) to process 5377 (root 5377 3854 5377 0.0 0.0 11352 0 612 1 16:30 00:00:00 /bin/sleep 1000)
[1]+ Terminated /bin/sleep 1000
#
If we add the -v switch to turn on verbose mode, we see the /bin/ps command CFEngine used to dump the process table:
# cf-agent -f unit_process_kill.cf -Kv
...
2013-06-08T16:38:20-0700 verbose: Observe process table with /bin/ps -eo user,pid,ppid,pgid,pcpu,pmem,vsz,ni,rss,nlwp,stime,time,args
2013-06-08T16:38:20-0700 verbose: Matched 'root 5474 3854 5474 0.0 0.0 11352 0 612 1 16:38 00:00:00 /bin/sleep 1000'
...
Classes promises may be made in any
bundle. Classes that are set in common bundles are global in scope,
while classes in all other bundles are local.
Note: The term class and context are sometimes used interchangeably.
bundle common g
{
classes:
"one" expression => "any";
"client_network" expression => iprange("128.39.89.0/24");
}
Description: Combine class sources with AND
The class on the left-hand side is set if all of the class expressions listed on the right-hand side are true.
Type: clist
Allowed input range: [a-zA-Z0-9_!@@$|.()\[\]{}:]+
Example:
classes:
"compound_class" and => { classmatch("host[0-9].*"), "Monday", "Hr02" };
Notes:
If an expression contains a mixture of different object types that need to be ANDed together, this list form is more convenient than providing an expression.
Description: Generate a probabilistic class distribution
Always set one generic class and one additional class, randomly weighted on a probability distribution.
Type: rlist
Allowed input range: -9.99999E100,9.99999E100
Example:
classes:
"my_dist"
dist => { "10", "20", "40", "50" };
Notes:
In the example above the values sum up to 10+20+40+50 = 120. When generating
the distribution, CFEngine picks a number between 1-120, and set the class
my_dist as well as one of the following classes:
my_dist_10 (10/120 of the time)
my_dist_20 (20/120 of the time)
my_dist_40 (40/120 of the time)
my_dist_50 (50/120 of the time)
Description: Evaluate string expression of classes in normal form
Set the class on the left-hand side if the expression on the right-hand side evaluates to true.
Type: class
Allowed input range: [a-zA-Z0-9_!@@$|.()\[\]{}:]+
Example:
classes:
"class_name" expression => "solaris|(linux.specialclass)";
"has_toor" expression => userexists("toor");
Description: Combine class sources with inclusive OR
The class on the left-hand side will be set if any one (or more) of the class expressions on the right-hand side are true.
Type: clist
Allowed input range: [a-zA-Z0-9_!@@$|.()\[\]{}:]+
Example:
classes:
"compound_test"
or => { classmatch("linux_x86_64_2_6_22.*"), "suse_10_3" };
Notes:
This is useful construction for writing expressions that contain functions.
Description: Make the class persistent to avoid re-evaluation
The value specifies time in minutes.
Type: int
Allowed input range: 0,99999999999
Example:
bundle common setclasses
{
classes:
"cached_classes"
or => { "any" },
persistence => "1";
"cached_class"
expression => "any",
persistence => "1";
}
Notes:
This feature can be used to avoid recomputing expensive classes calculations on each invocation. This is useful if a class discovered is essentially constant or only slowly varying, such as a hostname or alias from a non-standard naming facility.
For example, to create a conditional inclusion of costly class evaluations,
put them into a separate bundle in a file classes.cf.
# promises.cf
body common control
{
persistent_classes::
bundlesequence => { "test" };
!persistent_classes::
bundlesequence => { "setclasses", "test" };
!persistent_classes::
inputs => { "classes.cf" };
}
bundle agent test
{
reports:
!my_persistent_class::
"no persistent class";
my_persistent_class::
"persistent class defined";
}
Then create classes.cf
# classes.cf
bundle common setclasses
{
classes:
"persistent_classes" # timer flag
expression => "any",
persistence => "480";
"my_persistent_class"
or => { ...long list or heavy function... } ,
persistence => "480";
}
History: Was introduced in CFEngine 3.3.0
Description: Evaluate the negation of string expression in normal form
The class on the left-hand side will be set if the class expression on the right-hand side evaluates to false.
Type: class
Allowed input range: [a-zA-Z0-9_!@@$|.()\[\]{}:]+
Example:
classes:
"others" not => "linux|solaris";
"no_toor" not => userexists("toor");
Notes:
Knowing that something is not the case is not the same as not knowing whether something is the case. That a class is not set could mean either. See the note on Negative Knowledge.
Description: Scope of the class set by this promise.
Type: (menu option)
Allowed input range:
namespace
bundle
Default value: bundle in agent bundles, namespace in common bundles
Example:
classes:
"namespace_context"
scope => "namespace";
"bundle_or_namespace_context"; # without an explicit scope, depends on bundle type
"bundle_context"
scope => "bundle";
See also: scope in body classes
Description: Select one of the named list of classes to define based on host's fully qualified domain name, the primary IP address and the UID that cf-agent is running under.
The class is chosen deterministically (not randomly) but it is not possible to say which host will end up in which class in advance. Only that hosts will always end up in the same class every time.
Type: clist
Allowed input range: [a-zA-Z0-9_!@@$|.()\[\]{}:]+
Example:
bundle common g
{
classes:
"selection" select_class => { "one", "two" };
reports:
one::
"One was selected";
two::
"Two was selected";
selection::
"A selection was made";
}
Notes:
This feature is similar to the splayclass function. However,
instead of selecting a class for a moment in time, it always chooses one class
in the list; the same class each time for a given host. This allows hosts to
be distributed across a controlled list of classes (e.g for load balancing
purposes).
Description: Combine class sources with XOR
The class on the left-hand side is set if an odd number of class expressions on the right-hand side matches. This is most commonly used with two class expressions.
Type: clist
Allowed input range: [a-zA-Z0-9_!@@$|.()\[\]{}:]+
Example:
classes:
"order_lunch" xor => { "Friday", "Hr11"}; # we get pizza every Friday
Please note that CFEngine is offered on an "as is" basis without warranty of any kind, and that our products are not error or bug free. To the maximum extent permitted by applicable law, CFEngine on behalf of itself and its suppliers, disclaims all warranties and conditions, either express or implied, including, but not limited to, implied warranties of merchantability, fitness for a particular purpose, title and non-infringement with regard to the Licensed Software.
CFEngine includes the following 3rd party libraries and components:
Prototype: string_upcase(data)
Return type: string
Description: Returns data in uppercase.
Arguments:
data: string, in the range: .*Example:
body common control
{
bundlesequence => { "example" };
}
bundle agent example
{
vars:
"upcase" string => string_upcase("abc"); # will contain "ABC"
reports:
"upcased abc: $(upcase)";
}
Output:
R: upcased abc: ABC
History: Introduced in CFEngine 3.6
See also: string_downcase().
Prototype: userexists(user)
Return type: boolean
Description: Return whether user name or numerical id exists on this
host.
Checks whether the user is in the password database for the current host. The argument must be a user name or user id.
Arguments:
user: string, in the range: .*Example:
body common control
{
bundlesequence => { "example" };
}
bundle agent example
{
classes:
"ok" expression => userexists("root");
reports:
ok::
"Root exists";
!ok::
"Root does not exist";
}
Output:
R: Root exists
System variables are derived from CFEngine's automated discovery of system values. They are provided as variables in order to make automatically adaptive rules for configuration.
files:
"$(sys.resolv)"
create => "true",
edit_line => doresolv("@(this.list1)","@(this.list2)"),
edit_defaults => reconstruct;
The variable gives the kernel's short architecture description.
# arch = x86_64
The name of the directory where CFEngine looks for its binaries..
# bindir = /var/cfengine/bin
History: Introduced in CFEngine 3.6
The date of the system in canonical form, i.e. in the form of a class, from when the agent initialized.
# cdate = Sun_Dec__7_10_39_53_2008_
A variable containing the path to the CFEngine syntax analyzer
cf-promises on the platform you are using.
classes:
"syntax_ok" expression => returnszero("$(sys.cf_promises)");
The variable gives the version of the running CFEngine Core.
# cf_version = 3.0.5
The variable gives the major version of the running CFEngine Core.
# cf_version = 3.0.5
# cf_version_major = 3
History: Was introduced in 3.5.1, Enterprise 3.5.1.
The variable gives the minor version of the running CFEngine Core.
# cf_version = 3.0.5
# cf_version_minor = 0
History: Was introduced in 3.5.1, Enterprise 3.5.1.
The variable gives the patch version of the running CFEngine Core.
# cf_version = 3.0.5
# cf_version_patch = 5
History: Was introduced in 3.5.1, Enterprise 3.5.1.
This variable contains the name of the hard-class category for this host (i.e. its top level operating system type classification).
# class = linux
See also: sys.os
A variable containing the number of CPU cores detected. On systems which
provide virtual cores, it is set to the total number of virtual, not
physical, cores. In addition, on a single-core system the class 1_cpu
is set, and on multi-core systems the class n_cpus is set, where
n is the number of cores identified.
reports:
"Number of CPUS = $(sys.cpus)";
8_cpus::
"This system has 8 processors.";
History: Was introduced in 3.3.0, Enterprise 2.2.0 (2012)
The variable gives the location of the current users's master crontab directory.
# crontab = /var/spool/crontab/root
The date of the system as a text string, from when the agent initialized.
# date = Sun Dec 7 10:39:53 2008
A scalar variable containing the default path for the document root of the standard web server package.
History: Was introduced in 3.1.0, Enterprise 2.0.
The domain name as discovered by CFEngine. If the DNS is in use, it could
be possible to derive the domain name from its DNS registration, but in
general there is no way to discover this value automatically. The
common control body permits the ultimate specification of this value.
# domain = example.org
The variable gives the version of the running CFEngine Enterprise Edition.
# enterprise_version = 3.0.0
History: Was introduced in 3.5.0, Enterprise 3.0.0
reports:
enterprise::
"License expires $(sys.expires)";
The location of the system NFS exports file.
# exports = /etc/exports
# exports = /etc/dfs/dfstab
The name of the failsafe policy file.
# failsafe_policy_path = /var/cfengine/inputs/failsafe.cf
History: Introduced in CFEngine 3.6
A variable containing an operating system identification string that is used to determine the current release of the operating system in a form that can be used as a label in naming. This is used, for instance, to detect which package name to choose when updating software binaries for CFEngine.
These two variables are synonyms for each other.
History: Was introduced in 3.2.0, Enterprise 2.0
See also: sys.ostype
The fully qualified name of the host. In order to compute this value properly, the domain name must be defined.
# fqhost = host.example.org
See also: sys.uqhost
The location of the system filesystem (mount) table.
# fstab = /etc/fstab
This is a list variable containing a list of all known MAC addresses for system interfaces.
History: Was introduced in 3.3.0, Enterprise 2.2.0 (2011)
This contains the MAC address of the named interface. For example:
reports:
"Tell me $(sys.hardware_mac[eth0])";
History: Was introduced in 3.3.0, Enterprise 2.2.0 (2011)
The name of the current host, according to the kernel. It is undefined whether this is qualified or unqualified with a domain name.
# host = myhost
The name of the inputs directory where CFEngine looks for its policy files.
# inputdir = /var/cfengine/inputs
History: Introduced in CFEngine 3.6
The assumed (default) name of the main system interface on this host.
# interface = eth0
Displays a system list of configured interfaces currently active in use by the system. This list is detected at runtime and it passed in the variables report to the CFEngine Enterprise Database.
To use this list in a policy, you will need a local copy since only local variables can be iterated.
bundle agent test
{
vars:
# To iterate, we need a local copy
"i1" slist => { @(sys.ip_addresses)} ;
"i2" slist => { @(sys.interfaces)} ;
reports:
"Addresses: $(i1)";
"Interfaces: $(i2)";
"Addresses of the interfaces: $(sys.ipv4[$(i2)])";
}
History: Was introduced in 3.3.0, Enterprise 2.2.0 (2011)
Contains a space separated list of the flags of the named interface. e.g.
reports:
"eth0 flags: $(sys.interface_flags[eth0])";
Outputs:
R: eth0 flags: up broadcast running multicast
The following device flags are supported:
History: Was introduced in 3.5.0 (2013)
Displays a system list of IP addresses currently in use by the system. This list is detected at runtime and passed in the variables report to the CFEngine Enterprise Database.
To use this list in a policy, you will need a local copy since only local variables can be iterated.
bundle agent test
{
vars:
# To iterate, we need a local copy
"i1" slist => { @(sys.ip_addresses)} ;
"i2" slist => { @(sys.interfaces)} ;
reports:
"Addresses: $(i1)";
"Interfaces: $(i2)";
"Addresses of the interfaces: $(sys.ipv4[$(i2)])";
}
History: Was introduced in 3.3.0, Enterprise 2.2.0 (2011)
All four octets of the IPv4 address of the first system interface.
Note:
If your system has a single ethernet interface, $(sys.ipv4) will contain
your IPv4 address. However, if your system has multiple interfaces, then
$(sys.ipv4) will simply be the IPv4 address of the first interface in the
list that has an assigned address, Use $(sys.ipv4[interface_name]) for
details on obtaining the IPv4 addresses of all interfaces on a system.
The full IPv4 address of the system interface named as the associative
array index, e.g. $(ipv4[le0]) or $(ipv4[xr1]).
# If the IPv4 address on the interfaces are
# le0 = 192.168.1.101
# xr1 = 10.12.7.254
#
# Then the octets of all interfaces are accessible as an associative array
# ipv4_1[le0] = 192
# ipv4_2[le0] = 192.168
# ipv4_3[le0] = 192.168.1
# ipv4[le0] = 192.168.1.101
# ipv4_1[xr1] = 10
# ipv4_2[xr1] = 10.12
# ipv4_3[xr1] = 10.12.7
# ipv4[xr1] = 10.12.7.254
Note:
The list of interfaces may be acquired with getindices("sys.ipv4") (or
from any of the other associative arrays). Only those interfaces which
are marked as "up" and have an IP address will be listed.
The first octet of the IPv4 address of the system interface named as the
associative array index, e.g. $(ipv4_1[le0]) or $(ipv4_1[xr1]).
The first two octets of the IPv4 address of the system interface named as the associative array index, e.g. $(ipv4_2[le0]) or $(ipv4_2[xr1]).
The first three octets of the IPv4 address of the system interface named as the associative array index, e.g. $(ipv4_3[le0]) or $(ipv4_3[xr1]).
The digest of the host's cryptographic public key.
# sys.key_digest = MD5=bc230448c9bec14b9123443e1608ac07
Timestamp when last policy change was seen by host
The name of the directory where CFEngine looks for its libraries.
# libdir = /var/cfengine/inputs/lib/3.6
History: Introduced in CFEngine 3.6
The name of the directory where CFEngine looks for its libraries, without any prefixes.
# local_libdir = lib/3.6
History: Introduced in CFEngine 3.6
The name of the directory where CFEngine log files are saved
# logdir = /var/cfengine/
History: Introduced in CFEngine 3.6
reports:
enterprise::
"This version of CFEngine is licensed to $(sys.license_owner)";
History: Was introduced in version 3.1.4,Enterprise 2.0.2 (2011)
reports:
enterprise::
"There are $(sys.licenses_granted) licenses granted for use";
History: Was introduced in version 3.1.4,Enterprise 2.0.2 (2011)
The long architecture name for this system kernel. This name is sometimes quite unwieldy but can be useful for logging purposes.
# long_arch = linux_x86_64_2_6_22_19_0_1_default__1_SMP_2008_10_14_22_17_43__0200
See also: sys.ostype
The name of the system email spool directory.
# maildir = /var/spool/mail
The name of the directory on the hub where CFEngine looks for inputs to be validated and copied into sys.inputdir.
# masterdir = /var/cfengine/masterfiles
History: Introduced in CFEngine 3.6
The name of the operating system according to the kernel.
# os = linux
See also: sys.ostype
Another name for the operating system.
# ostype = linux_x86_64
See also: sys.class
The name of the directory where CFEngine saves the daemon pid files.
# piddir = /var/cfengine/
History: Introduced in CFEngine 3.6
Hostname of the machine acting as the policy server. This value is set during bootstrap. In case bootstrap was not performed, it is set to undefined.
reports:
"Policy hub is $(sys.policy_hub)";
History: Was introduced in version 3.1.0b1,Enterprise 2.0.0b1 (2010). Available in Community since 3.2.0
The kernel release of the operating system.
# release = 2.6.22.19-0.1-default
The location of the system resolver file.
# resolv = /etc/resolv.conf
A variable containing the time since the UNIX Epoch (00:00:00 UTC, January 1,
1970), measured in days. It is equivalent to $(sys.systime) divided by the
number of seconds in a day, expressed as an integer. No time zone conversion
is performed, the direct result of the time() system call is used. This value
is most commonly used in the /etc/shadow file.
# sysday = 15656
Corresponds to Monday, November 12, 2012.
History: Introduced in CFEngine 3.6
A variable containing the result of the time() system call, which is the
time since the UNIX Epoch (00:00:00 UTC, January 1, 1970), measured in
seconds. See also $(sys.sysday).
# systime = 1352754900
Corresponds to Mon Nov 12 21:15:00 2012 UTC.
History: Introduced in CFEngine 3.6
The name of the update policy file.
# update_policy_path = /var/cfengine/inputs/update.cf
History: Introduced in CFEngine 3.6
A variable containing the number of minutes which the system has been online. (Not implemented on the Windows platform.)
# uptime = 69735
Equivalent uptime command output:
16:24:52 up 48 days, 10:15, 1 user, load average: 0.00, 0.00, 0.00
History: Introduced in CFEngine 3.6
The unqualified name of the current host.
# uqhost = myhost
See also: sys.fqhost
The version of the running kernel. On Linux, this corresponds to the
output of uname -v.
# version = #55-Ubuntu SMP Mon Jan 10 23:42:43 UTC 2011
History: Was introduced in version 3.1.4,Enterprise 2.0.2 (2011)
On the Windows version of CFEngine Enterprise, this is the path to the Windows directory of this system.
# windir = C:\WINDOWS
On the Windows version of CFEngine Enterprise, this is the path to the program files directory of the system.
# winprogdir = C:\Program Files
On 64 bit Windows versions of CFEngine Enterprise, this is the path to the 32 bit (x86) program files directory of the system.
# winprogdir86 = C:\Program Files (x86)
On the Windows version of CFEngine Enterprise, this is the path to the Windows system directory.
# winsysdir = C:\WINDOWS\system32
The location of the CFEngine work directory and cache. For the system privileged user this is normally:
# workdir = /var/cfengine
For non-privileged users it is in the user's home directory:
# workdir = /home/user/.cfagent
On the Windows version of CFEngine Enterprise, it is normally under program files (the directory name may change with the language of Windows):
# workdir = C:\Program Files\CFEngine
Prototype: regline(regex, filename)
Return type: boolean
Description: Returns whether the anchored regular expression
regex matches a line in file filename.
Note that regex must match an entire line of the file in order to give a
true result.
Arguments:
regex: regular expression, in the range: .*filename: string, in the range: .*Example:
bundle agent example
{
files:
"/tmp/testfile" edit_line => test;
}
bundle edit_line test
{
classes:
"ok" expression => regline(".*XYZ.*","$(edit.filename)");
reports:
ok::
"File $(edit.filename) has a line with \"XYZ\" in it";
}
This function is useful for edit_line applications, where one might want to set a class for detecting the presence of a string that does not exactly match one being inserted. For example:
bundle edit_line upgrade_cfexecd
{
classes:
# Check there is not already a crontab line, not identical to
# the one proposed below...
"exec_fix" not => regline(".*cf-execd.*","$(edit.filename)");
insert_lines:
exec_fix::
"0,5,10,15,20,25,30,35,40,45,50,55 * * * * /var/cfengine/bin/cf-execd -F";
reports:
exec_fix::
"Added a 5 minute schedule to crontabs";
}
Use the following links to learn more about CFEngine:
Learn by reading information brought to you by CFEngine experts:
Learning CFEngine 3 by Diego Zamboni
CFEngine 3 Tutorial and Cookbook by Neil Watson, a Senior UNIX/Linux system admin and a CFEngine Champion.
CFEngine Resources by Vertical Sysadmin, Inc, a sysadmin training company and an authorized CFEngine training partner.
CFEngine Development blog Posts on configuration management best practices from the CFEngine team.
Online Training An introduction to CFEngine by our founder, Mark Burgess. These video recordings explain the basic principles and syntax of the CFEngine language and suggests some examples to try out.
Demos Videos, Webinars, and Keynotes which demonstrate the key capabilities of CFE Enterprise and Community editions.
CFEngine as a powerful security tool: Three presentations by Diego Zamboni
Download CFEngine code editors.
On-Site Training Sign up for professional training courses that provide a better understanding of CFEngine and how it can help improve configuration management in your organization.
Contact us to get more info on training courses.
Help from our CFEngine community is available to all users on our Google Groups forums:
Support for CFEngine Enterprise users Help for users who have downloaded the free version of CFEngine 3 Enterprise.
help-cfengine General help for all your CFEngine questions.
Sometimes the best help is already written.
Stay in touch. Follow us:
The #cfengine IRC channel on the irc.freenode.org network.
If you want to learn more about how CFEngine can help you and your organization, contact us.
CFEngine Github
Public Bug Tracker
Prototype: string_tail(data, max)
Return type: string
Description: Returns the last max bytes of data.
Arguments:
Example:
body common control
{
bundlesequence => { "example" };
}
bundle agent example
{
vars:
"end" string => string_tail("abc", "1"); # will contain "c"
reports:
"end of abc = $(end)";
}
Output:
R: end of abc = c
History: Introduced in CFEngine 3.6
See also: string_head(), string_length(), string_reverse().
CFEngine 3.6 is the latest version of CFEngine. The Enterprise edition introduces numerous improvements to the Mission Portal - a dashboard for getting a quick overview of the system status and compliance, alerts and notifications for changes to the system, a new user interface for inventory management and a tighter integration with Design Center.
Policy writers and community users, CFEngine 3.6 introduces a broad range of improvements and new functionality to the policy language, new capabilities for configuration management and tighter integration with data from external sources.
A number of changes have been made to the CFEngine core to further improve stability, scalability and security.
The new users promise type allows for management and configuration of local user
accounts with CFEngine.
The new variable type data allows handling of structured data within CFEngine policy.
Structured data can be read from JSON strings and files, which allows integrating of
CFEngine policies with any external data source that can export to JSON.
A range of new functions allow creating and operating on structured data.
Classes and variables can be tagged with meta data for extended annotation and documentation of knowledge directly in the language. Classes and variables can be searched by tags in policy, and CFEngine Enterprise uses tags to identify relevant information reported by the host. CFEngine sets a number of tags on hard classes and special variables by default.
CFEngine 3.6 introduces support for mustache templates, which
is tightly integrated with data containers and provides easy and data-driven configuration
file management.
CFEngine 3.6 adds a list of new built-in functions:
bundlesmatching() - returns list of defined bundles matching a regexcanonifyuniquely() - converts a string into a unique, legal class nameclassesmatching() - returns list of set classes matching a regexeval() - evaluates mathematical expressionsfindfiles() - returns list of files matching a search patternmakerule() - evaluates whether a target file needs to be rebuilt from sourcesmax(), mean(), min() - returns maximum, mean and minimum in a container or listpackagesmatching() - returns a filtered list of installed packages.string_downcase(), string_upcase() - returns the lower-/upper-case version of a stringstring_head(), string_tail() - returns the beginning/end of a stringstring_length() - returns the length of a stringstring_reverse() - reverses a stringvariablesmatching() - returns a list of variables matching a regexvariance() - returns the variance of numbers in a listThe following functions are added and improved to work with the new data container
type:
data_readstringarray() - read a delimited file into a data mapdata_readstringarrayidx() - read a delimited file into a data arraydatastate() - create a data variable with currently set classes and variablesdatatype() -format() - %S can be used to serialize 'data' containers into a stringmergedata() - merge two data containersparsejson() - create a data container from a JSON stringreadjson() - create a data container from a file that contains JSONstorejson() - serialize a data container into a stringCFEngine 3.6 introduces a new networking protocol, which uses TLS for authentication. After the authentication, all dialog is encrypted within the established TLS session.
To ease with the upgrade process, cf-serverd is still able to speak the legacy
protocol with old agents, and new agents can speak the legacy protocol with old servers.
CFEngine operators should turn off support for the legacy protocol as soon as all hosts
are running 3.6 to benefit from the full encryption and future improvements.
The new network protocol supports a range of new attributes for more precise access control to server resources.
CFEngine 3.6 uses LMDB as the default embedded database. LMDB is both robust and fast, and replaces TokyoCabinet on the majority of supported platforms.
Logging output of the CFEngine binaries has been further improved: cf-serverd now includes
the relevant client IP address in all messages; reports promises generate messages without
prefix except R:, and execution state information (such as passes or promise type
changes) are included in the log.
Relative paths are supported in copy_from promises, and can used together with the
shortcut aliasing based on connection data in access promises to implement simple
and dynamic multi-tenancy within a single policy server.
CFEngine 3.6 introduces a flexible and dynamic dashboard with alerts and notifications to the Mission Portal. Users can create conditions and group those together in dashboard widgets that provide a quick overview over various business-critical aspects of the CFEngine managed system.
Inventory reports provide fast access to the managed assets, be it hosts or software. Inventory data can be added through policy to read additional information from sources available to each host, such as a CMDB.
The Enterprise platform in 3.6 is using PostgreSQL, which significantly improves the speed of reports in the Mission Portal and through the Enterprise APIs. The Enterprise Server uses an optimized data collection protocol that reduces the network traffic and allows for even greater scalability.
The Enterprise API provides faster access to more data about hosts, promise compliance, software inventories, classes and variables. Thanks to the PostgreSQL backend the API supports complex SQL queries. The API from CFEngine Enterprise 2.2 is no longer supported.
The integration with authentication services (LDAP or ActiveDirectory) has changed to allow filter stings to be specified, providing greater flexibility in controlling access to CFEngine Enterprise.
A number of improvements to CFEngine's string handling on Windows makes sure that line endings are preserved in modified files, and use Windows compliance CRLF endings in newly created files.
For a complete history of changes in CFEngine, see the ChangeLog and
Enterprise ChangeLog.
Central to CFEngine's effectiveness in system administration is the concept of a "promise," which defines the intent and expectation of how some part of an overall system should behave.
CFEngine emphasizes the promises a client makes to the overall CFEngine network. Combining promises with patterns to describe where and when promises should apply is what CFEngine is all about.
This document describes in brief what a promise is and what a promise does. There are other resources for finding out additional details about "promises" in the See Also section at the end of this document.
A promise is the documentation or definition of an intention to act or behave in some manner. They are the rules which CFEngine clients are responsible for implementing.
When you make a promise it is an effort to improve trust, which is an economic time-saver. If you have trust then there is less need to verify, which in turn saves time and money.
When individual components are empowered with clear guidance, independent decision making power, and the trust that they will fulfil their duties, then systems that are complex and scalable, yet still manageable, become possible.
bundle agent hello_world
{
reports:
any::
"Hello World!"
comment => "This is a simple promise saying hello to the world.";
}
Everything in CFEngine can be thought of as a promise to be kept by different resources in the system. In a system that delivers a web site using Apache, an important promise may be to make sure that the httpd or apache package is installed, running, and accessible on port 80.
Writing, deploying, and using CFEngine promises will generally follow these simple steps:
hello_world.cf)./var/cfengine/masterfiles (can be under a sub-directory).promise on the policy server, generally in the file /var/cfengine/masterfiles/promises.cf, or a file elsewhere but referred to in promises.cf.
* Optional: it is also possible to call a bundle manually, using cf-agent.policy file was deployed and successfully run.See Tutorial for Running Examples for a more detailed step by step tutorial.
CFEngine does not make absolute choices for you, like other tools. Almost everything about its behavior is a matter of policy and can be changed.
In order to keep operations as simple as possible, CFEngine maintains a
private working directory on each machine, referred to in documentation as WORKDIR and in policy by
the variable $(sys.workdir) By default, this is located at
/var/cfengine or C:\var\CFEngine. It contains everything CFEngine needs to
run.
The figure below shows how decisions flow through the parts of a system.
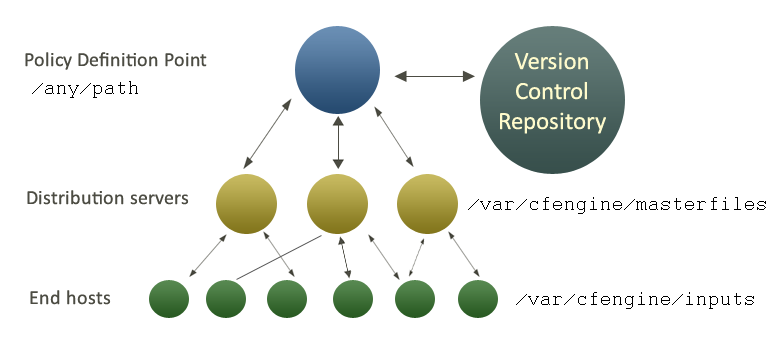
It makes sense to have a single point of coordination. Decisions are therefore usually made in a single location (the Policy Definition Point). The history of decisions and changes can be tracked by a version control system of your choice (e.g. git, Subversion, CVS etc.).
Decisions are made by editing CFEngine's policy file promises.cf (or one
of its included sub-files). This process is carried out off-line.
Once decisions have been formalized and coded, this new policy is copied
to a decision distribution point, $(sys.masterdir) which
defaults to /var/cfengine/masterfiles on all policy distribution servers.
Every client machine contacts the policy server and downloads these updates. The policy server can be replicated if the number of clients is very large, but we shall assume here that there is only one policy server.
Once a client machine has a copy of the policy, it extracts only those promise proposals that are relevant to it, and implements any changes without human assistance. This is how CFEngine manages change.
CFEngine tries to minimize dependencies by decoupling processes. By following this pull-based architecture, CFEngine will tolerate network outages and will recover from deployment errors easily. By placing the burden of responsibility for decision at the top, and for implementation at the bottom, we avoid needless fragility and keep two independent quality assurance processes apart.
Policy Style Guide This covers punctuation, whitespace, and other styles to remember when writing policy.
Bundles Best Practices Refer to this page as you decide when to make a bundle and when to use classes and/or variables in them.
Testing Policies This page describes how to locally test CFEngine and play with configuration files.
Classes fall into hard (discovered) and soft (defined) types. This reference documents the hard classes that might be set by CFEngine, and soft classes used by CFEngine's default policy.
To see hard classes and soft classes defined in common bundles on a
particular host, run cf-promises --show-classes as a privileged user.
Example:
[root@hub masterfiles]# cf-promises --show-classes
Class name Meta tags
10_0_2_15 inventory,attribute_name=none,source=agent,hardclass
127_0_0_1 inventory,attribute_name=none,source=agent,hardclass
192_168_33_2 inventory,attribute_name=none,source=agent,hardclass
1_cpu source=agent,derived-from=sys.cpus,hardclass
64_bit source=agent,hardclass
Afternoon time_based,source=agent,hardclass
Day22 time_based,source=agent,hardclass
...
Note that some of the classes are set only if a trusted link can be established
with cf-monitord, i.e. if both are running with privilege, and
the /var/cfengine/state/env_data file is secure.
You can also use the built-in classesmatching() function to get a
list of all the defined classes in a list, inside CFEngine policy
itself. classesmatching() is especially useful because it also lets
you specify tag regular expressions.
See also: The --show-vars option.
Classes and variables have tags that describe their provenance (who created them) and purpose (why were they created).
While you can provide your own tags for soft classes in policy with
the meta attribute, there are some tags applied to hard classes and
other special cases. This list may change in future versions of
CFEngine.
source=agent: this hard class or variable was created by the agent in the C code. This tag is useful when you need to find classes or variables that don't match the other sources below. e.g. linux.source=environment: this hard class or variable was created by the agent in the C code. It reflects something about the environment like a command-line option, e.g. -d sets debug_mode, -v sets verbose_mode, and -I sets inform_mode. Another useful option, -n, sets opt_dry_run.source=bootstrap: this hard class or variable was created by the agent in the C code based on bootstrap parameters. e.g. policy_server is set based on the IP address or host name you provided when you ran cf-agent -B host-or-ip.source=module: this class or variable was created through the module protocol.source=persistent: this persistent class was loaded from storage.source=body: this variable was created by a body with side effects.source=function: this class or variable was created by a function as a side effect, e.g. see the classes that selectservers() sets or the variables that regextract() sets. These classes or variables will also have a function=FUNCTIONNAME tag.source=promise: this soft class was created from policy.inventory: related to the system inventory, e.g. the network interfaces
attribute_name=none: has no visual attribute name (ignored by Mission Portal)attribute_name=X: has visual attribute name X (used by Mission Portal)monitoring: related to the monitoring (cf-monitord usually).time_based: based on the system date, e.g. Afternoonderived-from=varname: for a class, this tells you it was derived from a variable name, e.g. if the special variable sys.fqhost is xyz, the resulting class xyz will have the tag derived-from=sys.fqhost.cfe_internal: internal utility classes and variablesEnterprise only:
source=ldap: this soft class or variable was created from an LDAP lookup.source=observation: this class or variable came from a measurements system observation and will also have the monitoring tag.any: this class is always setam_policy_hub, policy_server: set when the file
$(workdir)/state/am_policy_hub exists. When a host is bootstrapped, if
the agent detects that it is bootstrapping to itself the file is created.bootstrap_mode: set when bootstrapping a hostinform_mode, verbose_mode, debug_mode: log verbosity levels in order of noisinessopt_dry_run: set when the --dry-run option is givenfailsafe_fallback: set when the base policy is invalid and the built-in failsafe.cf (see bootstrap.c) is invokedcommunity, community_edition) and (enterprise, enterprise_edition): the two different CFEngine products, Community and Enterprise, can be distinguished by these mutually exclusive sets of hard classesagent cf-agent, server cf-serverd, monitor cf-monitord, executor cf-execd, runagent cf-runagent, keygenerator cf-keygen, hub cf-hub, common cf-promises and others: classes that identify the current component. cf-promises is a special case because it's not an agent in the CFEngine sense, so note that using cf-promises --show-classes will not show these classes because it can't.arista, big_ip, debian, eos, fedora, Mandrake, Mandriva, oracle, redhat, slackware, smartmachine, smartos, solarisx86, sun4, SuSE, ubuntu, ultrix, the always-favorite unknown_ostype, etc.VMware, virt_guest_vz, virt_host_vz, virt_host_vz_vzps, xen, xen_dom0, xen_domu_hv, xen_domu_pv, oraclevmserver, etc.zone_global, zone_foo, zone_baz).DomainController, Win2000, WinServer, WinServer2003, WinServer2008, WinVista, WinWorkstation, WinXPhave_aptitude, powershell, systemd: based on the detected capabilities of the platform or the compiled-in optionssys.arch, sys.class, sys.flavor, sys.os, sys.ostype.www.sales.company.com and www.research.company.com have the
same unqualified name – wwwipv4_192_0_0_1, ipv4_192_0_0, ipv4_192_0, ipv4_192)mac_unknown: set when the MAC address can't be foundsys.domain, sys.hardware_addresses, sys.sys.host, sys.interface, sys.interfaces, sys.interface_flags, sys.ipv4, sys.ip_addresses, sys.fqhost, sys.uqhost.Time Classes
Monday, Tuesday, Wednesday,...GMT_Monday, GMT_Tuesday, GMT_Wednesday,...Hr00, Hr01,... Hr23 and Hr0, Hr1,... Hr23GMT_Hr00, GMT_Hr01, ...GMT_Hr23 and GMT_Hr0, GMT_Hr1, ...GMT_Hr23.Min00, Min17,... Min45,... and GMT_Min00, GMT_Min17,... GMT_Min45,...Min00_05, Min05_10,... Min55_00 and GMT_Min00_05, GMT_Min05_10,... GMT_Min55_00. Note the second number indicates up to what minute the interval extends and does not include that minute.Q1, Q2, Q3, Q4 and GMT_Q1, GMT_Q2, GMT_Q3, GMT_Q4Hr12_Q3 and GMT_Hr12_Q3Day1, Day2,... Day31 and GMT_Day1, GMT_Day2,... GMT_Day31January, February,... December and GMT_January, GMT_February,... GMT_DecemberYr1997, Yr2004 and GMT_Yr1997, GMT_Yr2004Night, Morning, Afternoon, Evening and GMT_Night, GMT_Morning, GMT_Afternoon, GMT_Evening (six hour blocks starting at 00:00 hours).Lcycle_0, Lcycle_1, Lcycle_2 and GMT_Lcycle_0, GMT_Lcycle_1, GMT_Lcycle_2 (the year number modulo 3, used in long term resource memory).sys.cdate, sys.date.The unqualified name of a particular host (e.g., www). If
your system returns a fully qualified domain name for your host
(e.g., www.iu.hio.no), CFEngine will also define a hard class for
the fully qualified name, as well as the partially-qualified
component names iu.hio.no, hio.no, and no.
sys.fqhost, sys.uqhost.An arbitrary user-defined string (as specified in the -D
command line option, or defined in a classes promise promise or
classes body,
restart_class in a processes promise, etc).
The IP address octets of any active interface (in the form
ipv4_192_0_0_1<!-- /@w -->, ipv4_192_0_0<!-- /@w -->,
ipv4_192_0<!-- /@w -->, ipv4_192<!-- /@w -->), provided they
are not excluded by a regular expression in the file
WORKDIR/inputs/ignore_interfaces.rx.
The names of the active interfaces (in the form
net_iface_xl0, net_iface_vr0).
System status and entropy information reported by
cf-monitord.
Soft classes can be set by using the -D or --define options wihtout having
to edit the policy. Multiple classes can be defined by separating them with
commas (no spaces).
$ cf-agent -Dclass
or
$ cf-agent --define class1,class2,class3
This can be especially useful when requesting a remote host to run its policy
by using cf-runagent to activate policy that is normally dormant.
$ cf-runagent -Demergency_evacuation -H remoteclient
If you're using dynamic inputs this can be useful in combination with
cf-promises to ensure that various input combinations syntax is validated
correctly. Many people will have this run by pre-commit hooks or as part of a
continuous build system like Jenkins or
Bamboo.
$ cf-promises -f ./promises.cf -D prod
$ cf-promises -f ./promises.cf -D dev
./promises.cf:10:12: error: syntax error
"global1" expression => "any";
^
./promises.cf:10:12: error: Check previous line, Expected ';', got '"global1"'
"global1" expression => "any";
^
./promises.cf:10:23: error: Expected promiser string, got 'expression'
"global1" expression => "any";
^
./promises.cf:10:26: error: Expected ';', got '=>'
"global1" expression => "any";
^
2014-05-22T13:46:05+0000 error: There are syntax errors in policy files
Note: Classes, once defined, will stay defined either for as long as the
bundle is evaluated (for classes with a bundle scope) or until the agent
exits (for classes with a namespace scope). See cancel_kept,
cancel_repaired, and cancel_notkept in classes body.
Description: Disable a CFEngine Enterprise daemon component persistently.
DAEMON can be one of cf_execd, cf_monitord or cf_serverd.
This will stop the AGENT from starting automatically.
Description: Re-enable a previously disabled CFEngine Enterprise daemon component.
DAEMON can be one of cf_execd, cf_monitord or cf_serverd.